JavaScript is an open-source multi-paradigm programming language mainly used to develop web applications. It can seamlessly connect with web technologies like HTML, CSS, and XML. In most cases, JavaScript is used as a programming tool for client-side projects. However, Node.js, a JavaScript framework, can also enable backend web app development.
JavaScript is a popular programming language used by developers. According to the TIOBE index, it ranked sixth as of November 2024.
Surprisingly, JavaScript can be used for data science and data analysis. However, most work in those spheres has already been done using Python and R. These programming languages have well-known frameworks, such as Pandas, NumPy, S3, and S4. Developers constantly use them in data science projects to handle large data sets and data analysis.
Generally, Python, R, SQL, MATLAB, Java, Scala, Julia, and Perl are among the top programming languages for data science. Each offers unique strengths and applications in data analysis and machine learning.
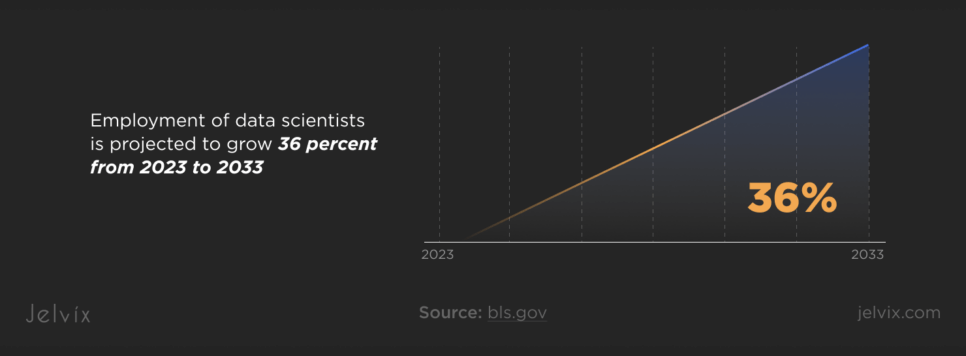
Data science itself is also constantly growing. Employment of data scientists is projected to grow 36 percent from 2023 to 2033, much faster than the average for all occupations. Over the decade, about 20,800 openings for data scientists are projected each year.
Of course, developing and offering new technologies in a constantly evolving field is very tempting. But can JavaScript be a viable tool for data science? You can get answers to this question in the following sections.
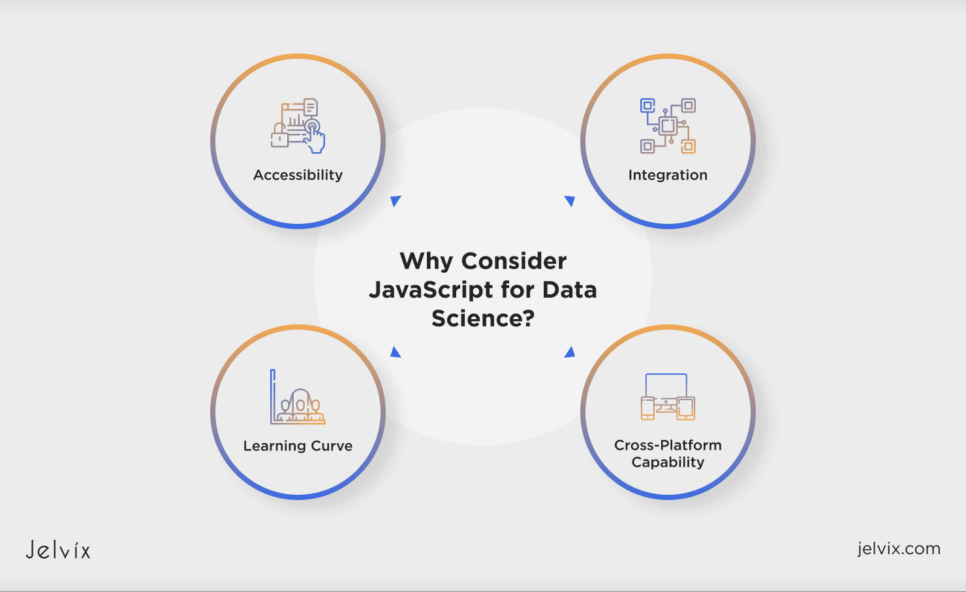
Why Consider JavaScript for Data Science?
At first glance, Javascript is unexpectedly placed among programming languages that are suitable for data science. However, there are some reasons why this scripting language can be used for data processing and analysis purposes, which are listed below.
Accessibility
JavaScript is widely used in web browsers. 99% of websites use this programming language on the client side. This makes JavaScript accessible and ready for quick setup without complex installation procedures. Widespread availability in web development allows using this language for data analysis on websites and web-based data with visualization tools. Functional syntax also helps in writing the code for data science projects.
Integration
JavaScript seamlessly integrates with HTML, CSS, and web technologies that support interactive visualizations. This programming language has multiple libraries that facilitate real-time data visualization and analysis. Among the most popular is D3.js, which works with data visualization and is used for machine learning projects.
Less popular but still in use data visualization libraries are Chart.js and Plotly.js. They enable integrations with web applications that allow you to build charts you can see on the screen. You have all the necessary tools for custom data visualization with such libraries.
Learning Curve
Developers can harness JavaScript as a dynamically typed language. Its syntax is functional and straightforward. JavaScript’s community is active and abundant. Beginners can easily find frameworks, plugins, libraries, and support for free. A vast number of learning materials will also be helpful for nearly starting data scientists.
Cross-Platform Capability
As a client-side scripting language, JavaScript is easily compatible with web-based applications. However, you can also use this language for server-side programming with the help of frameworks like Node.js. The Node.js framework enables server-side data processing and analysis. JavaScript’s event-based programming and asynchronous nature make it suitable for real-time applications dealing with considerable amounts of data.
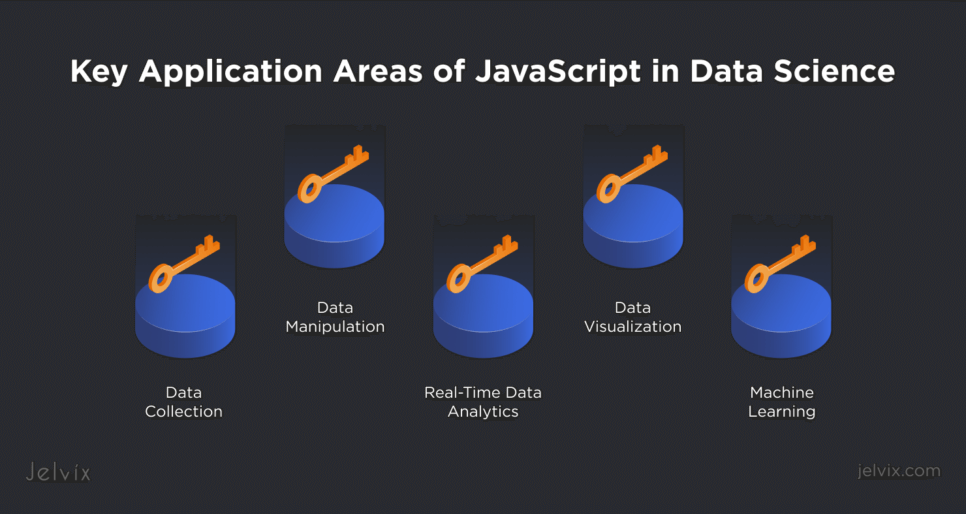
Key Application Areas of JavaScript in Data Science
Let’s examine JavaScript applications in data science to see how this programming language can be used in each case. Here are the primary data science applications of JavaScript and its ecosystem.
Data Collection
The web universe continues to grow. There are over 193 billion websites on the internet, and almost 180,000 websites appear daily. Many websites contain invaluable information for marketing, finance, statistical analysis, and other purposes. Different companies use special applications to collect data from those web pages. The web scraping software market is estimated to reach $2.45 billion by the end of 2036, growing at a CAGR of 13.25% during the forecast period.
Modern data collection using web scraping or parsing accomplishes such tasks.
JavaScript Node.js libraries such as Puppeteer, Playwright, and Cheerio easily handle web scraping.
Cheerio doesn’t have a built-in HTTP client but can be used for web parsing through the Axios library. It is user-friendly, allowing beginners to work on basic projects. Puppeteer and Playwright seamlessly work with the JavaScript HTTP client, which simplifies web parsing. However, it has a steeper learning curve because it needs to handle browser instance setup, page life cycle events, and navigation.
Both tools can be used efficiently for web scraping.
Data Manipulation
With JavaScript, efficient data manipulation and analysis is also possible. JavaScript has core data structures called arrays. You can transform and use them to store and retrieve data. Developers can sort, filter, or change individual parts of data. They can also use the functional programming capability of JavaScript for data analysis, manipulation, transformation, value aggregation, and filtering data subsets according to specific criteria.
Frameworks such as Lodash, Danfo.js, and Simple-statistics help coders work with data. The JavaScript Lodash library has data preprocessing, validation, and alteration functions. With the Lodash library, you can transform and operate with missing, duplicate, and aggregate values.
Danfo.js library facilitates work with datasets, helping with reading, data manipulation, processing, and transforming.
A JavaScript library called Simple-statistics offers statistical methods for data analysis. It is an excellent option for data scientists who must find relationships and interdependencies between data sets.
Data Visualization
JavaScript excels at creating visually appealing charts or graphs within web applications. Several tools, such as D3.js, Chart.js, and Plotly.js libraries, can be used to develop dashboards, charts, and other data visualization products.
D3.js can create multiple data visualization objects using Scalable Vector Graphics (SVG). These visualizations are scalable and suitable for users with different screen sizes and resolutions. This JavaScript library also offers the development of interactive visualizations that enable users to interact with the data model. This is possible by adding animation to the project and handling event-based processes.
Chart.js and Plotly.js are JavaScript libraries that help create highly customizable graphs. You can change the design, color, font, and other visual elements, develop several charts, and display them simultaneously.
Those instruments also allow annotations, which are helpful for data analysis and presentations. Developers use JavaScript for data visualization tasks, providing visually rich, interactive visualizations that display data for further analysis.
Machine Learning
TensorFlow.js and Brain.js are great tools for using machine learning (ML) capabilities. The Brain.js library assists in neural network training, avoiding the complexities of mathematical models.
TensorFlow.js is a good option for developers who want to embed ML in their website or web application. The TensorFlow.js library enables the development and training of machine learning models. This library will be helpful for developers who want to test products and applications. Data scientists can significantly automate data analysis tasks with the help of ML.
Real-Time Data Analytics
JavaScript event-handling functionalities help develop real-time data monitoring and customized dashboards. Many industries, such as stock tracking, FinTech, social media, monitoring systems, the Internet of Things (IoT), sports, and many others, leverage the real-time visualization capabilities of JavaScript and its ecosystem.
Discover a comprehensive list of top data science programming languages and their practical applications.
JavaScript vs. Python and R
Of course, many of you will deny the JavaScript data science applications. There are well-known and commonly used programming languages in this area, such as Python and R. But don’t jump to conclusions yet. JavaScript has advantages and disadvantages compared with Python and R. Sometimes, they can complement each other.
Strengths of JavaScript
Here are the typical pros of JavaScript programming language in data science:
- Integration with web technologies: JavaScript is a staple in web development, so seamless integration with HTML, XML, and CSS is natural. Data science using web applications won’t cause any problems with connectivity;
- Visualization: JavaScript offers powerful data visualization libraries such as D3.js, Plotly.js, Chart.js, and many others. They assist in making insightful data visualization charts and dashboards that streamline data analysis;
- Machine learning capabilities: TensorFlow.js and Brain.js libraries allow you to create efficient ML models and train them properly. Such libraries facilitate data analysis automation and improve overall business processes.
JavaScript’s Challenges
JavaScript has specific limitations compared with Python and R:
- Lacking functionality: Python and R have more data science packages and built-in features than JavaScript. So, for basic projects, JavaScript is applicable, while for most data analysis and ML software development applications, it is not the best option;
- Low computational efficiency: JavaScript is mostly an event-based and single-threaded language. Python and R support parallelism, which means that they can proceed and operate with more data per unit of time using paralleled processes compared with JavaScript;
- Poor developer productivity: It is challenging for coders to find data science solutions for JavaScript projects. Ecosystems of Python and R related to the data science domain are much more extensive;
- Learning cost: Developers would rather spend more time learning Python frameworks than tinkering with Javascript libraries.
How Can JavaScript Complement Python or R?
Python and R are well-suited for data processing, analysis, and integration. You can use R for statistical analysis and visualization. However, you can also use JavaScript libraries for astonishing data visualization.
JavaScript is prominent in data science projects on the client side, while Python and R can be used on the server side and in statistical computing.
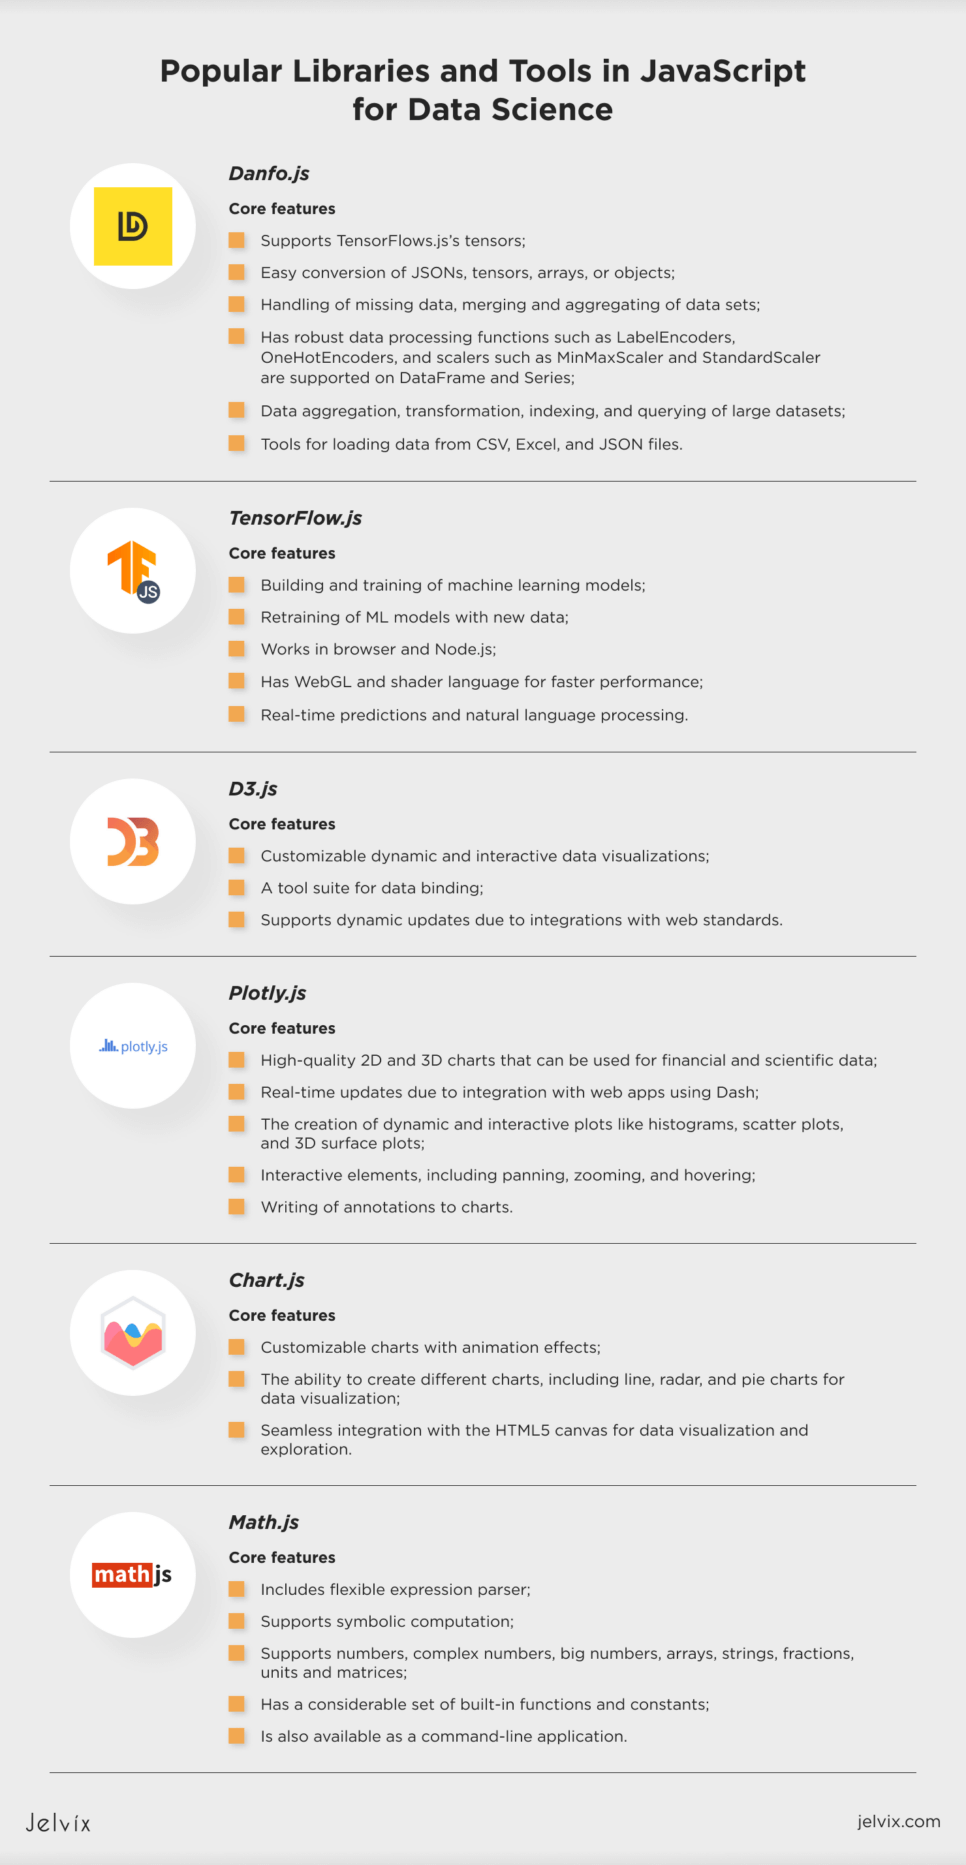
Popular Libraries and Tools in JavaScript for Data Science
JavaScript libraries and other tools significantly contribute to creating data science projects based on this programming language. Below, you can see the most widely-used libraries the developers utilize to master data science applications.
Danfo.js
Danfo.js is an open-source JavaScript library inspired by Python’s Pandas. It also works with data manipulation, and its interface is similar to Pandas’s. So, there is no problem learning Danfo.js for developers who already use Pandas in Python.
Danfo.js offers a wide range of functionalities for efficient data processing and manipulation.
Core features:
- Supports TensorFlows.js’s tensors;
- Easy conversion of JSONs, tensors, arrays, or objects;
- Handling of missing data, merging and aggregating of data sets;
- Has robust data processing functions such as LabelEncoders, OneHotEncoders, and scalers such as MinMaxScaler and StandardScaler are supported on DataFrame and Series;
- Data aggregation, transformation, indexing, and querying of large datasets;
- Tools for loading data from CSV, Excel, and JSON files.
TensorFlow.js
TensorFlow.js is a JavaScript library created by Google that allows developers to build machine learning models in the browser or Node.js. This tool enables coders to develop and train ML models within a JavaScript environment.
Core features:
- Building and training of machine learning models;
- Retraining of ML models with new data;
- Works in browser and Node.js;
- Has WebGL and shader language for faster performance;
- Real-time predictions and natural language processing.
D3.js
D3.js is an open-source JavaScript library. D3 stands for data-driven documents. The library assists in creating interactive and dynamic data visualizations. It allows you to design graphs, bar charts, and schedule scatter plots. D3.js is a Document Object Model (DOM) that can be used for powerful data-driven transformation to present data in a visually appealing format. Its flexible and extensive visualization capabilities make it an excellent option for custom data visualizations on web applications.
Core features:
- Customizable dynamic and interactive data visualizations;
- A tool suite for data binding;
- Supports dynamic updates due to integrations with web standards.
Other JavaScript Tools for Data Science
Plotly.js
Plotly.js is another powerful tool for data visualization. This high-level declarative charting library is built on stack.gl and D3.js. With Plotly.js, you can create a wide range of data visualizations, including geographic mapping, scientific and financial charts, and 3D visualizations. The library supports bar charts, schedule plots, and many other charts. Plotly.js allows you to analyze data from any angle and depth to make informed business decisions.
Core features:
- High-quality 2D and 3D charts that can be used for financial and scientific data;
- Real-time updates due to integration with web apps using Dash;
- The creation of dynamic and interactive plots like histograms, scatter plots, and 3D surface plots;
- Interactive elements, including panning, zooming, and hovering;
- Writing of annotations to charts.
Chart.js
Chart.js is an open-source JavaScript library for designers and developers. This flexible and simple library can help you create multiple charts, including line, bar, pie, and radar charts. You can easily integrate dynamic and interactive charts with contemporary web frameworks. Chart.js is an excellent choice for visualizing data using numerous data representation features.
Core features:
- Customizable charts with animation effects;
- The ability to create different charts, including line, radar, and pie charts for data visualization;
- Seamless integration with the HTML5 canvas for data visualization and exploration.
Math.js
Math.js is an open-source math library for Node.js and JavaScript. It’s a powerful computation tool with an extensive range of built-in functions and constants. With Math.js, you can work with data types such as numbers, complex numbers, big numbers, units, fractions, and arrays. This is an indispensable assistant for any data scientist and data analyst.
Core features:
- Includes flexible expression parser;
- Supports symbolic computation;
- Supports numbers, complex numbers, big numbers, arrays, strings, fractions, units and matrices;
- Has a considerable set of built-in functions and constants;
- Is also available as a command-line application.
Use Cases and Real-World Examples
Developers can use JavaScript and its libraries in various spheres where data science is applicable, including fintech, sports, healthcare, etc.
One of the most prominent examples of using JavaScript is in the financial domain. Web monitoring of financial markets in real-time can be a proper application of JavaScript. Dashboards and real-time charts on financial trading platforms provide insightful information about market situations and allow you to build forecasts. Market participants can make quick decisions based on analytics in a graphical format. JavaScript and its ecosystem’s functionality assist in creating real-time dashboards in web applications.
Enterprises can also use interactive web dashboards to display the latest public financial statements to stakeholders.
Tensorflow.js can be efficiently used for machine learning projects. Developers can create ML-based applications that work with image recognition. Such apps can be utilized in different spheres where applicable, i.e., in the medical industry.
Natural language processing, part of machine learning, can use Tensorflow.js for tasks such as text translation, classification, and sentiment analysis.
ML models built using the Tensorflow.js library can work with large data sets. They can be trained and retrained with new data. Machine learning helps in more precise data analysis and forecasting.
Healthcare projects using JavaScript can include monitoring patients’ health data. For example, data analysts can collect information from medical wearable devices and present it conveniently using web applications to make specific patient health predictions.
JavaScript Challenges and Limitations in Data Science
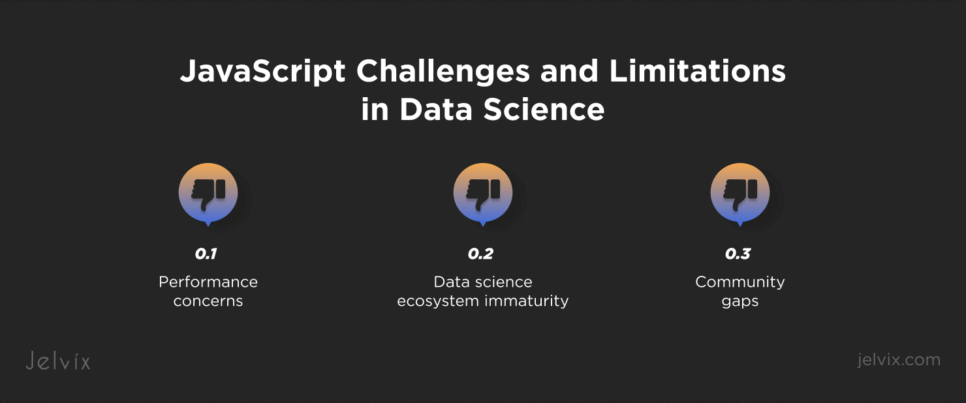
Some specific limitations and challenges prevent developers from using JavaScript for data science. Here are the most critical of them:
- Performance concerns: JavaScript is single-threaded, which can be an issue for data processing that requires high speed. Asynchronous programming partially reduces this problem. However, JavaScript generally works slower than Python and C++.
- Data science ecosystem immaturity: Python frameworks such as Pandas, NumPy, and Scikit-learn have much more extensive functionalities than JavaScript ones. This limits the use of JavaScript for data science tasks.
- Community gaps: Javascript lacks resources for data science, and developers struggle to find the necessary information on time. Python and R have much more resources to offer data scientists and developers.
Future of JavaScript in Data Science
JavaScript is continuously evolving to provide developers and data scientists with new tools for data science. JavaScript libraries have become more interconnected with other ecosystems, such as Python and R, and are supporting data science projects. They can efficiently complement each other.
JavaScript can also expect a performance boost from WebGPU and WebAssembly. They can be efficiently used for data-intensive tasks.
The demand for web applications is still rising. The latest statistics from the US Bureau of Labor Statistics show that the employment of web developers and designers is expected to grow by 8%, faster than the average for all occupations.
This means that JavaScript will be relevant for real-time web-based applications in data science, analysis, and visualization. Therefore, its frameworks and libraries will develop and improve their capabilities.
Discover the flexible nature of JavaScript and combine it with other data science tools to create your full-stack projects.
Conclusion
JavaScript is currently losing out to established tools like Python and R when developing data science projects. It needs more track records and resources for developers’ support in this area. Its performance is also not ideal because of its single-threaded nature. Python and R offer developers and data science professionals a wider range of tools, including libraries and frameworks, than JavaScript.
However, JavaScript will be relevant for many years because of the continuous growth of web application development and its use in data science. Real-time monitoring and data visualization in web app development are a few applications where this programming language can compete with data science ‘giants.’
JavaScript is evolving, adjusting its features, and adding new ones to keep up with emerging machine learning technologies.
Data scientists can use JavaScript to monitor and visualize data in real time in the financial sphere, healthcare, sports, and many other industries.
By the way, Jelvix experts use JavaScript to develop front-end and back-end projects. Our professionals can help you create web and cross-platform mobile apps using JavaScript technologies.
Contact us to create your successful custom web-based JavaScript project that satisfies customers’ needs completely.
FAQ
Can JavaScript replace Python or R in data science?
Although JavaScript is expanding in data science, Python and R remain the top choices for intensive computations and statistical evaluations. JavaScript is most effective when integrated with web applications and used for real-time analytics.
What libraries are best for data science in JavaScript?
Widely used libraries include Danfo.js for handling data, TensorFlow.js for conducting machine learning, and D3.js for creating visualizations. These tools facilitate the connection between conventional data science and JavaScript’s functionalities.
Is JavaScript suitable for handling large datasets?
JavaScript is capable of handling smaller datasets efficiently. However, it can face performance challenges when dealing with large-scale data because of its single-threaded design. To some degree, libraries such as Node.js can assist in alleviating this issue.
How can I get started with data science using JavaScript?
Start with fundamental libraries like Chart.js for visual representation or Danfo.js for handling data. Try out small projects, such as building dashboards or processing datasets within the browser.
Are there jobs in data science that require JavaScript skills?
Yes, especially in positions that require developing interactive dashboards, connecting machine learning models to web applications, or focusing on real-time analytics for client applications.
Need high-quality professionals?
Scale your development capacity with top-level expertise and resources.


