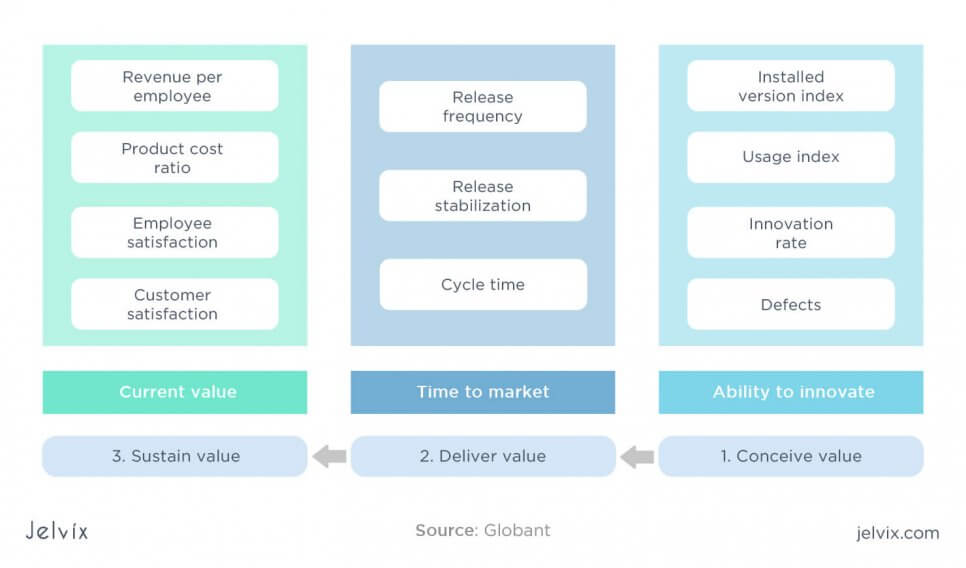
Using Agile metrics to measure the team’s productivity is the key part of Agile’s philosophy. Team managers and all members should see the consequences of their work and use this data to improve workflow and increase efficiency.
End-users and clients can also benefit from the use of Agile project metrics that focus on evaluating the result of the product. Metrics allow scrum masters, developers, designers, and testers to measure the performance of the application and track if current and previous tasks make the product better.
In this article, we’ll review Agile metrics that matter and share our experience of applying this Agile metrics dashboard to a real-life project. It turns out, to lead a team successfully and deliver results, you not only need to know which metrics to apply but how to do it — we’ll share how we figured it out.
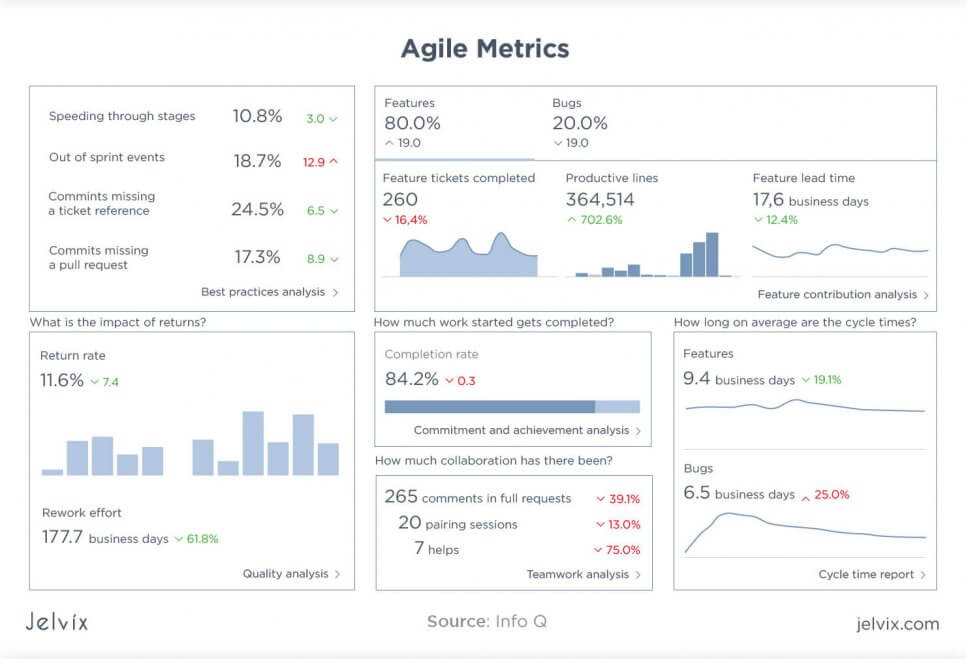
Types of common Agile metrics
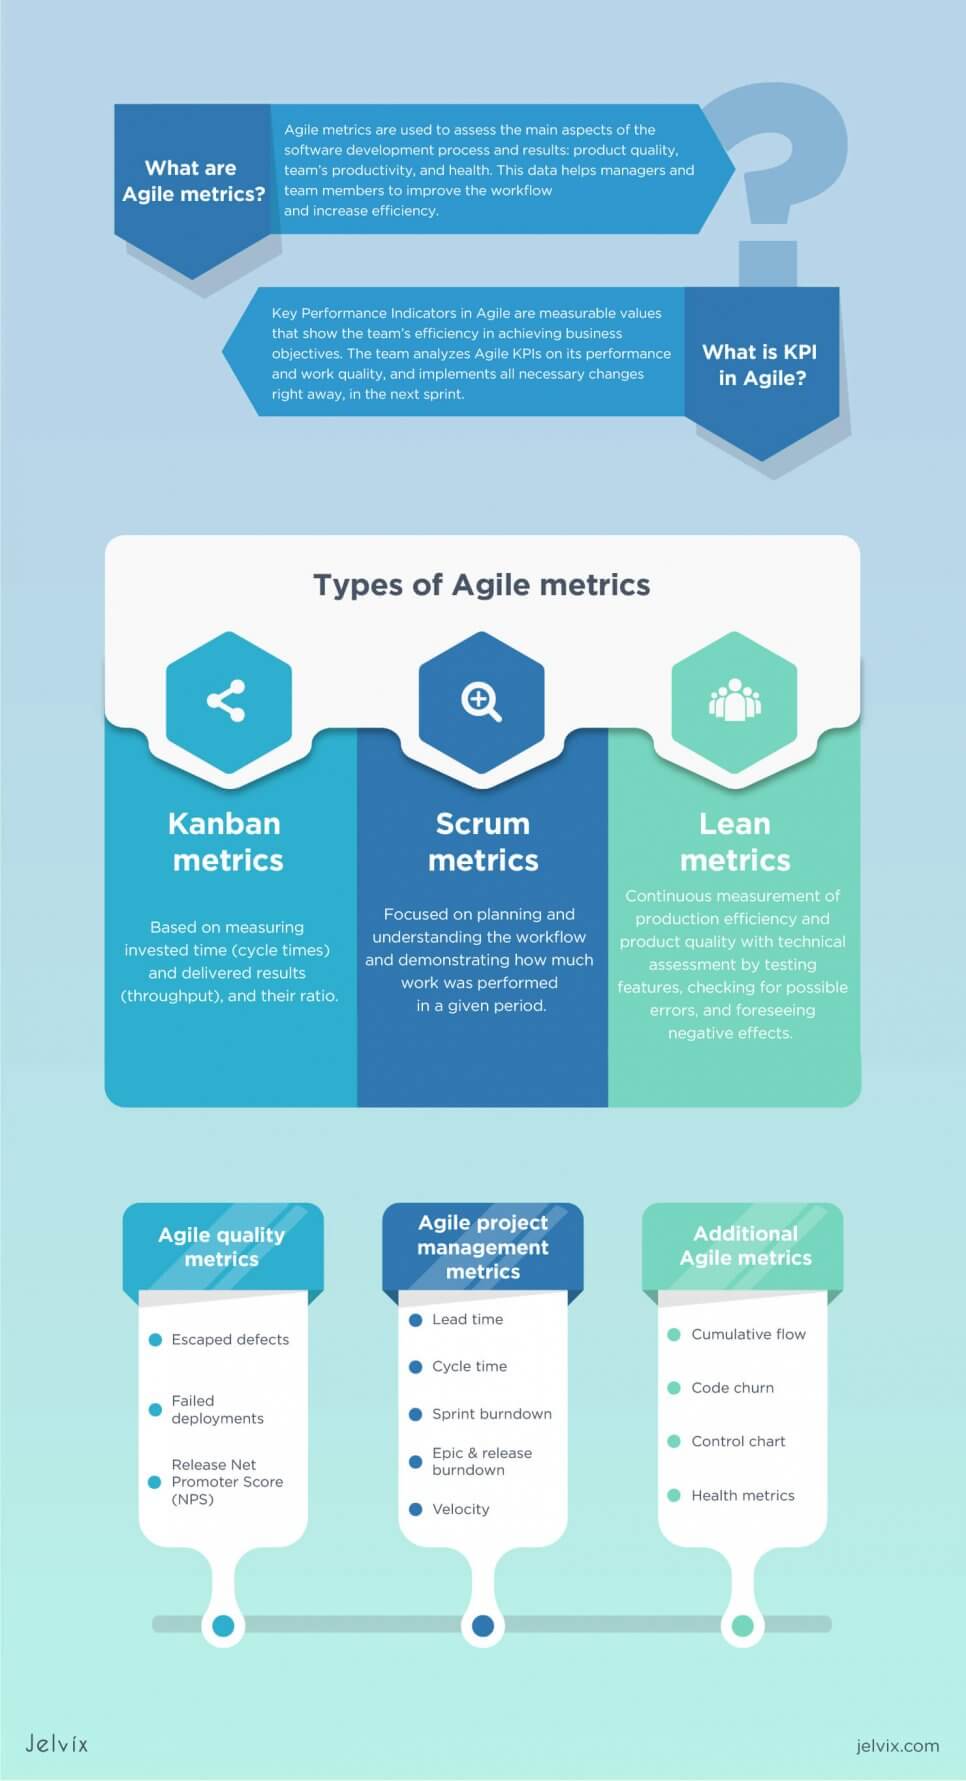
The classification of Agile metrics isn’t set in stone — it’s always changing and restructuring. Still, over the years, we’ve seen the rise of three main kinds of Agile metrics in various Agile frameworks.
- Kanban metrics — these metrics are based on measuring invested time (cycle times) and delivered results (throughput), and their ratio.
- Scrum metrics — metrics, which are focused on planning and understanding the workflow and demonstrating how much work was performed in a given period;
- Lean metrics — the continuous measurement of production efficiency and product quality with technical assessment by testing features, checking for possible errors, and foreseeing negative effects.
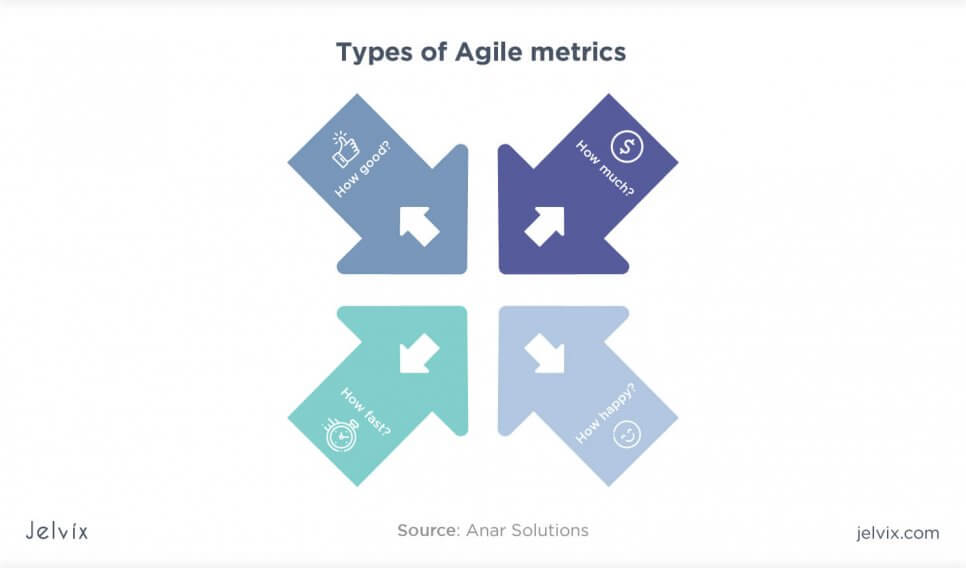
We use all three types of metrics to assess the main aspects of the software development process and results: product quality, team’s productivity, and health.
Agile quality metrics
Before you start measuring the team’s velocity and efficiency, you need to know if you are generally moving in the right direction. What’s the use in prompt delivery of all development tasks, if the tasks itself are formed the wrong way? The priority for each software development team and manager is to make sure that all activities are related to improving the product — this is done by measuring its quality and detecting negative tendencies.
Escaped defects
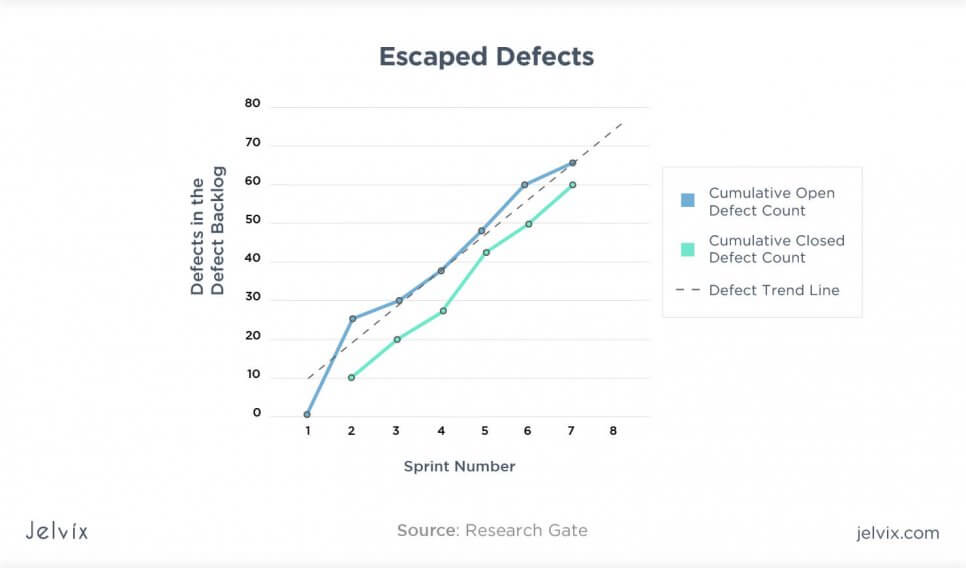
Each Agile project has sprints or work cycles, at the end of which a certain task is delivered. After the work was complete, the team’s manager has to assess the quality of turned-it results. All changes, edits, and unfixed bugs are escaped defects — issues that developers could’ve fixed but didn’t. Record their precise number and nature to know what mistakes usually escape developers’ eyes.
After you’ve done a report on escaped defects and collected tangible statistics, you need to discuss the results with your team. Make sure each team member knows what kinds of errors the team typically misses. If you have individual suggestions, discuss them with team members one-on-one.
Failed deployments
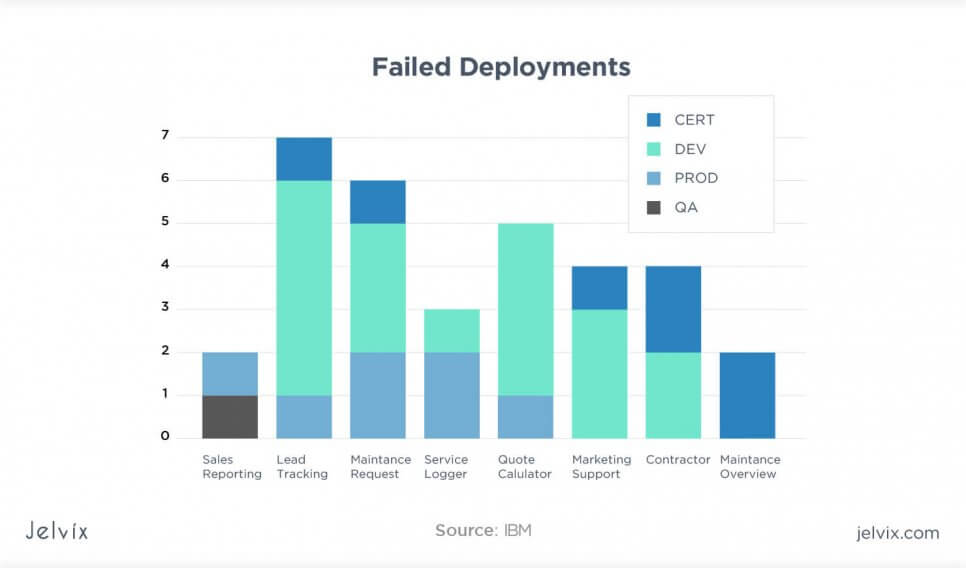
If the product was deployed but not released or failed to attract users, this is recorded as a failed deployment. Sometimes, a failed deployment happens to the decisions of one of the stakeholders, or the business model proves to be unreliable. Whatever was the cause of the problem, you need to record all failed deployments along with reasons for their failure.
Before releasing a new deployment, the team can always take a look at the list of previously failed deployments and examine if this one can’t undergo the same process. Analyzing the reasons for the failure of previous versions allows for avoiding future issues.
Release Net Promoter Score (NPS)
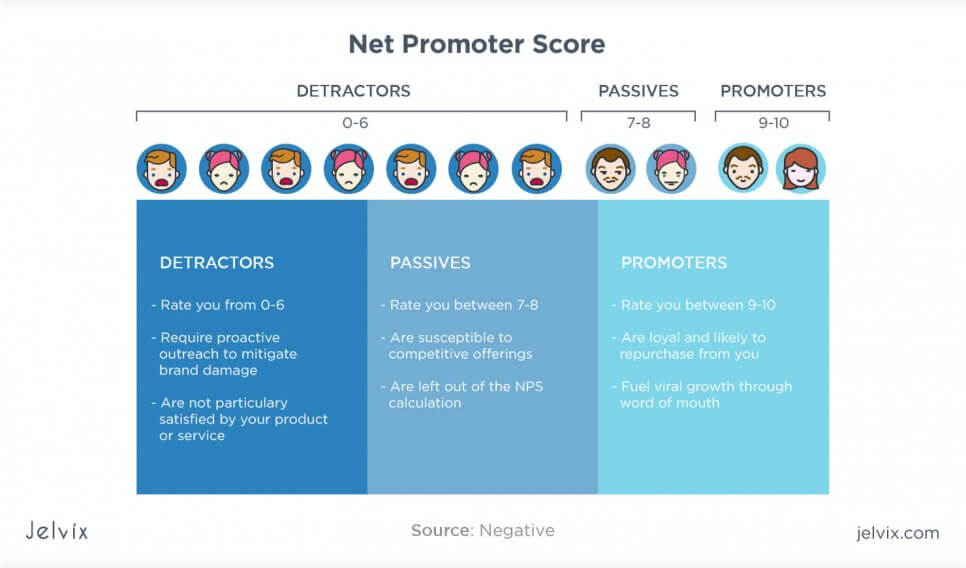
The Net Promoter Score is the metric that involves evaluating users’ reactions in quantitative (numbers, statistics, average ratings) and qualitative feedback (reviews, direct feedback, messages, emails, calls). After the team collected and analyzed the feedback, each team member suggests a score that evaluates how much the user is likely to recommend the product (typically, scores are set in limits from 1 to 10).
Agile project management metrics
After you have a full history of previous failures and successes, you can analyze the direction taken for all current incomplete projects and give out relevant tasks, relying on previous experiences. After you’ve established the direction of development — the “what to do” of the product,” you need to assess the team’s efficiency — it’s the “how are we doing” factor. You can use Agile project metrics to know if team members meet your expectations, understand their tasks, manage deadlines, and if all processes are coordinated and synchronized.
Lead time
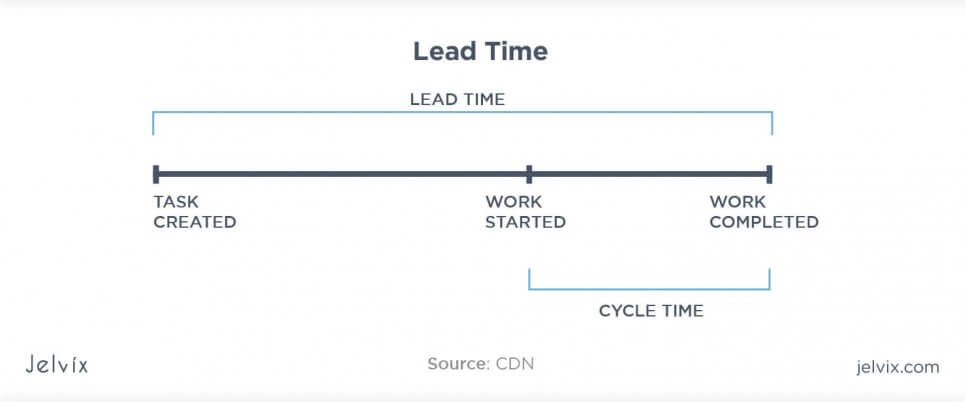
Lead time is a metric that allows teams to check how much it took for the product backlog entry to arrive at the end of the sprint. It can be used to track products at any development stage, task by task, or assess the overall time expenses, from ideation to release. It’s a long-term metrics that developers can use while planning their future work and estimating prices.
Be sure to record lead time for each of your projects. It’s best to keep both bigger-picture statistics that cover the entire project, and have organized sprint metrics — so you can examine each stage separately.
Cycle time
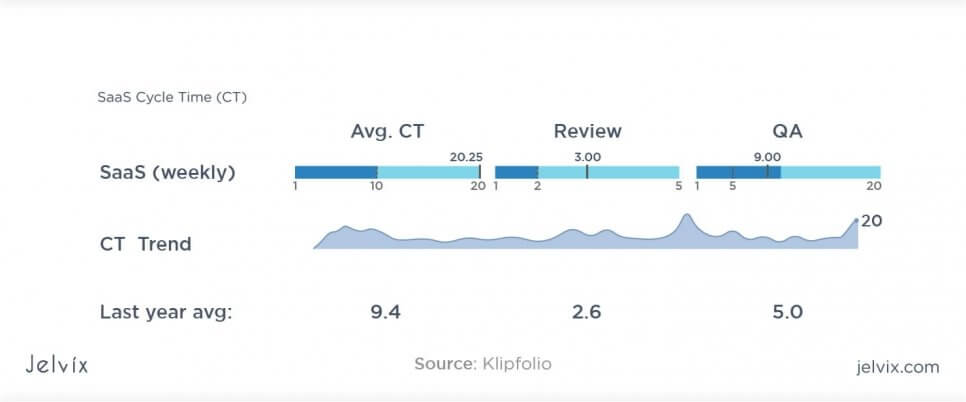
If Lead Time is among long-term team performance metrics, cycle time focuses on individual tasks. This metric evaluates the duration of a single cycle, where one cycle is taken by one task, calculates the number of cycles per project, and measures accomplished results for the end-user if the product is already beta-tested or released.
With cycle time, teams can immediately see if one task takes too much time or if some team members aren’t delivering on their ends. This short-term metric makes project management much easier and helps to quickly pinpoint issues as they arise.
Sprint burndown
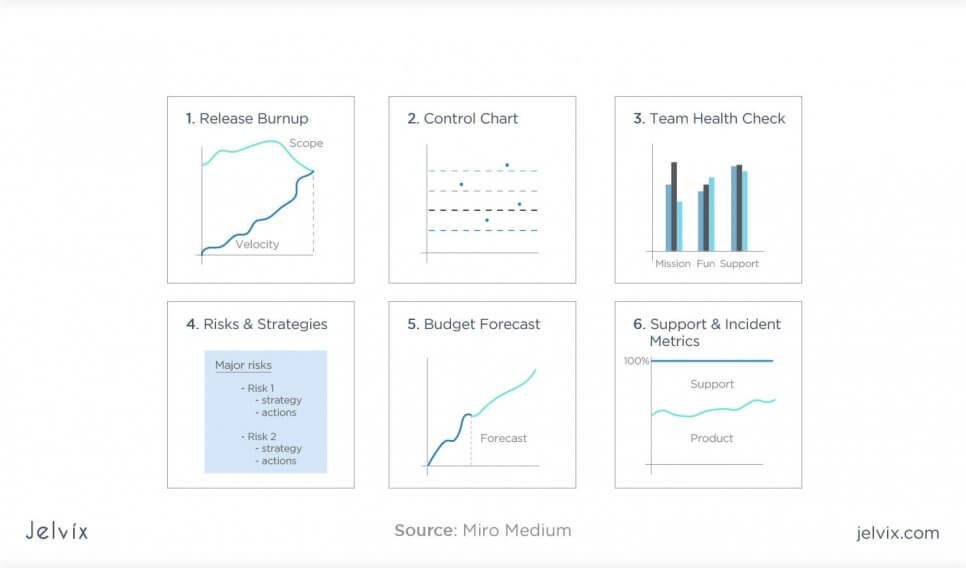
This metric is applied both short-term and long-term. Managers can create sprint burndown Scrum reports in real-time to track their team’s progress on the current project — for this, they need to estimate the total number of sprints and predict likely time expenses. It can also be used long-term — managers can analyze reports on previous projects, pinpoint stages that failed expected timeframes, and analyze causes of delays.
Most importantly, sprint burndown allows tracking the dynamics of teams’ workflow. Some members tend to take work slower at the first stages, while others burn out towards the end of the project. With sprint burndowns, team leaders can detect these tendencies, determine their causes, and help members with work distribution and time management.
Learn more about advantages and disadvantages of Agile in software development!
Epic & Release burndown
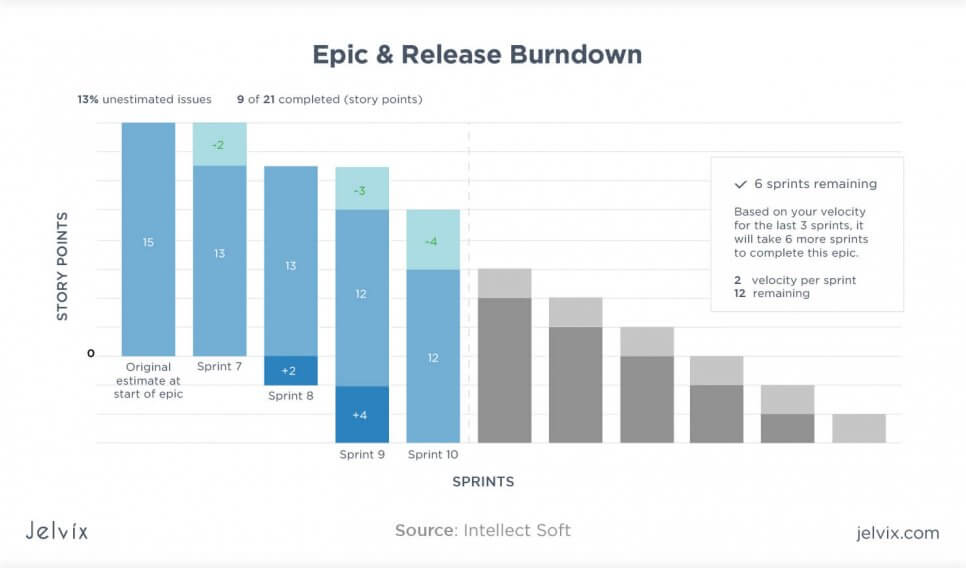
This metric is similar to Sprint Burndown — the only key difference is that it focuses on the team’s productivity before and after the release. Managers can add new requirements and incorporate tasks that are based on the end-users’ feedback. It’s an improved version of sprint burndown, as it also incorporates tasks given after the release of the project.
Velocity
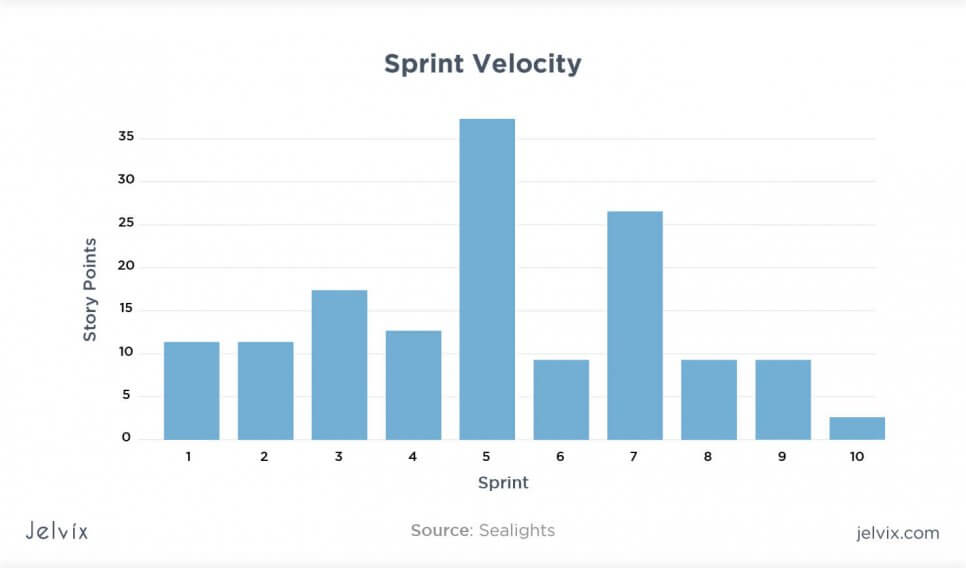
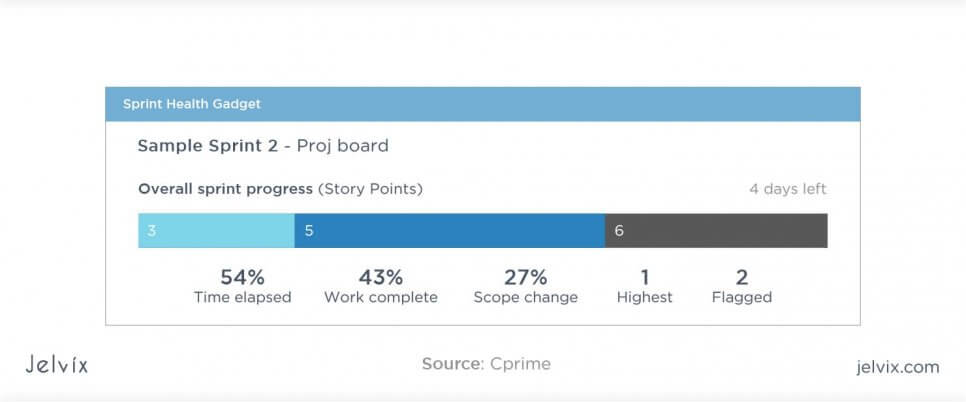
This metric evaluates the number of completed story points over a particular period. Based on your history, you can foresee time expenses for future story points. The decrease of the team’s velocity on particular sprints can point at misunderstanding among team members or indicated tasks that are harder than previously anticipated.
Learn how to successfully begin digital transformation for your business with actionable strategies to enhance efficiency, innovation, and growth.
Additional Agile metrics
Agile metrics help the team to know their project better and keep track of many significant aspects of product development. There are also Agile metrics for senior executives that allow seeing the bigger picture of development and the team’s well-being. According to our experience, these additional metrics help measure any aspect of your work. Yet, we defined the key characteristics that tell the most about the final product and help deliver a fully complete result.
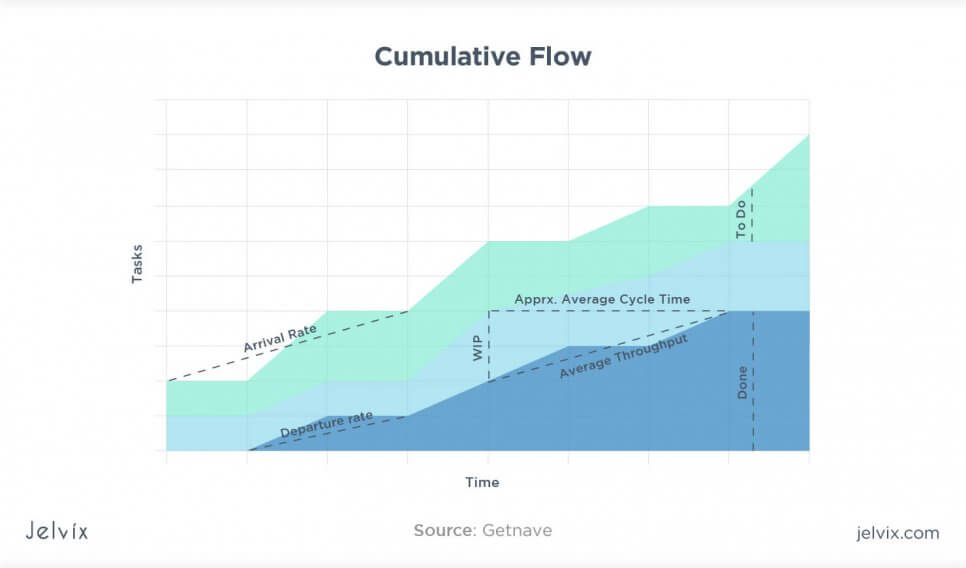
Cumulative flow
The name of the metric clearly communicates its purpose — to accumulate all project flows and evaluate them in a single diagram. Having such a graph will provide you with a big-scale view — it can be sent to project stakeholders who don’t have time to analyze more detailed Agile reports.
The diagram usually describes the following processes:
- Tasks in backlog: how many tasks in backlog team members have over the given timeframe;
- Approved work: how many tasks among planned ones were completed — the team manager immediately sees the differences between planned and finalized activities;
- Buffer tasks: all work that is waiting for approval is defined to be in a buffer zone;
- In progress: you need to evaluate the current workload.
Code churn
This metric shows the trends of code base changes before the release. Churn diagrams show how much code was added, removed, or changed once at a time. At early sprints, there will be many spikes and falls on the graph, because the code is still unstable, but as the project progresses, the code churn graph should become stable, with no drastic ups and downs.
Before the release, the churn should get a decline — adding or editing code before the very release means it will not undergo sufficient testing. Overall, whenever there is an irregularity on the Agile charts, investigate the reasons.
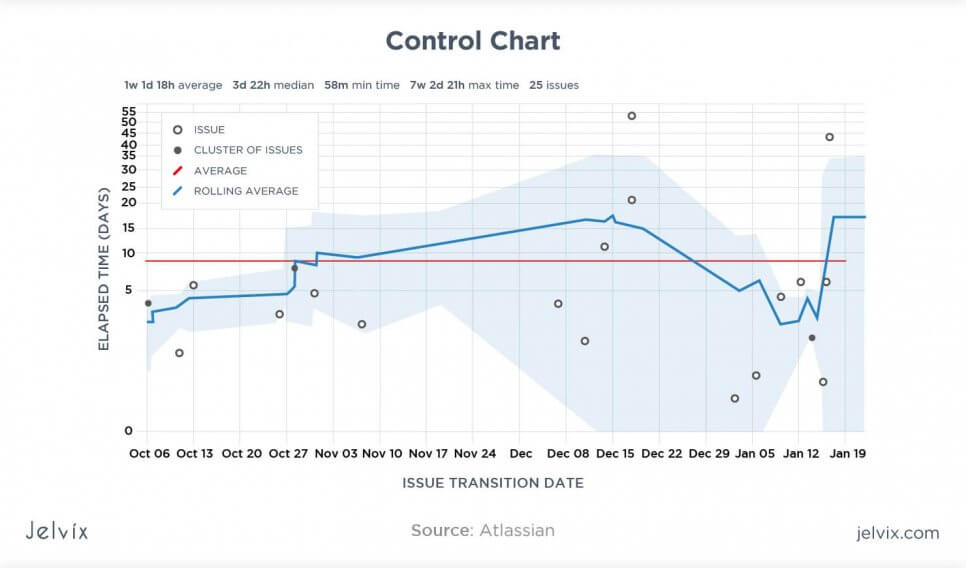
Control chart
A control chart is a chart where the team can see information on the duration of their cycle times. The ideal result would have the line on the chart steadily going down with time — it would mean the increase of the team’s velocity — less time is required per single cycle. Another important aspect is consistency — cycle times need to stay even regardless of the type of the task — it means you have correct work distribution.
Health metrics
Software development teams have to focus on long-term priorities, such as keeping communication between members smooth and checking if everyone is satisfied. Agile is a flexible methodology, which means it can adapt to the interests of different members, as soon as managers know what to pay attention to. Here’s how we find out if all our team members are happy with the workflow.
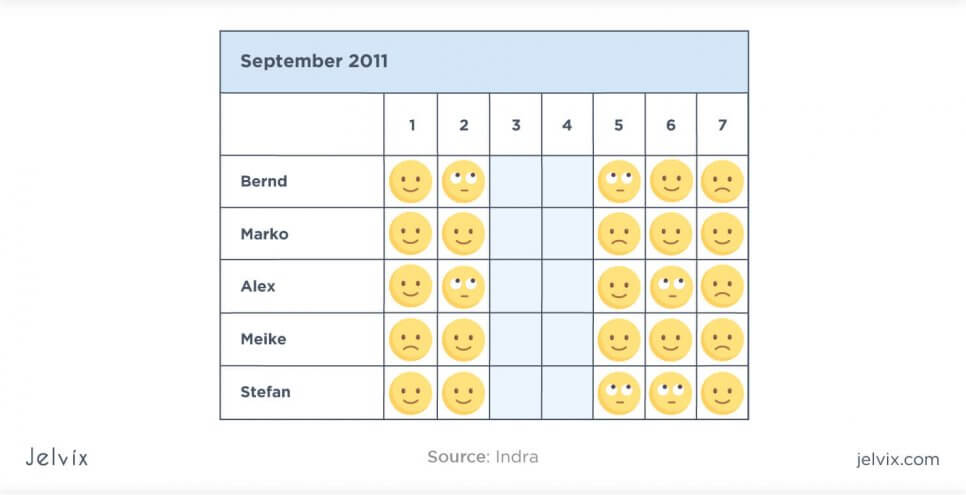
Happiness
If you have trusted, informal relationships in your team, it’s easier to start with an open dialog with each member. Ask everyone to rate their experience in the company from 1 to 5. You can ask assisting questions — what are the best and worst aspects of their work, what could be improved, and what could increase happiness? If the team doesn’t have friendly communication habits, using anonymous surveys can lead to more objective results.
Team morale
Team morale and happiness aren’t the same things. Happiness has more to do with comfort, whereas team morale is tied to productivity, self-esteem, evaluation of own professional qualities. Again, you can ask employees to rate their morale from 1 to 5 and ask the following questions;
- Did working in the company help to improve your skills?
- How much is your full potential explored with the current workload?
- Do you enjoy your work?
- Do you see the clear results of your work?
- Are you enthusiastic about new projects?
The goal here is to understand that the team’s development current goes in the right direction. Sometimes, the software development team’s manager takes profitable but boring tasks, ignoring members’ interests. This survey will help you see if employees are excited and challenged by their work.
Team member turnover
If team managers frequently replace team members, it means that the work environment is likely unhealthy. A certain rate of turnover over time is healthy — in fact, you don’t want to have any addition of people for years, as it would mean stagnation. However, you should watch out for sudden spikes in activity — months when several people left the team, or many people joined. If you have a sudden addition of many new participants, you need to pay attention to the onboarding process before going directly to the project-related work.
Measuring benefits for end-users
Agile teams should know how well the product fits the needs of a final user and business owner. This is done with a comprehensive code analysis that determines code quality and its usability for a final user, as well as possible maintenance complications.
Static code analysis
It’s the simple type of code analysis when the software is inactive. Just by monitoring code automatically with open-source tools, you can identify security issues, detect technical debt and bugs, and send problematic code fragments to the garbage collector.
Dynamic code analysis
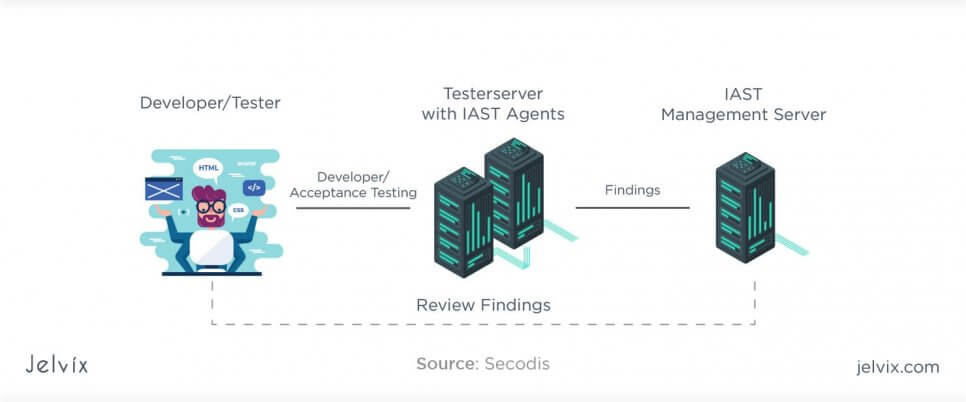
Dynamic code analysis requires your team to run software to evaluate the experience received by end-users. We encourage our developers and testers to always put themselves in users’ shoes, exploring the most common scenarios. For instance, they can introduce their colleagues and family members to the solution, requesting feedback — unless it’s not prohibited by the agreement. Most importantly, we have a team of QA professionals who are fully responsible for dynamic code analysis — although we believe that the more people contribute to testing metrics in Agile, the better is the final product quality.
How to apply the best Agile metrics
Out of all the variety of available Agile metrics, you need to select the ones that will be relevant for your team and projects long-term. Keeping track of these key characteristics should be a habit, while it shouldn’t distract you from more urgent work. Here’s how we seamlessly incorporated Agile metrics into our workflow.
Focus on performance, budget, and quality
You need to make sure that, after selecting all the metrics, you will be able to have a clear picture of your work’s quality, load, time expenses, and budget. Firstly, we set up short-term metrics that relate to our active projects: cycle time and velocity for Agile performance evaluation, code analysis for code quality assessment, and cumulative flow to keep track of all development processes and their costs.
During the first sprint, we make sure to do the following:
- Define how many sprints and cycles will the project have;
- Estimate the time expenses for the entire project, taking into account the client’s needs;
- Assessing competitive solutions to understand the level of complexity of the final product;
- Collect feedback from our team members on their expectations on the project’s most exciting, challenging, and difficult aspects.
This way, we can know how much time we will spend to complete the project, set quality standards based on similar solutions, and whether our team is motivated to work on the tasks or not (it has a huge impact on productivity).
Metrics after the first sprint
Here, we focus on getting feedback from the client and all team members. After the first sprint, we want to know that all parties involved in the workflow understand the process and feel comfortable. Also, we emphasize on evaluating code quality — we even plan code analysis and tech debt evaluation as the part of each of our next sprints. As soon as the first lines of code were written, maintaining its quality is our priority.
Velocity comes after
Velocity is one of the most important metrics in our projects, but not the key one. We refrain from basing our judgment on velocity numbers at the initial stages. The strategy of quickly getting through the first steps is a disaster waiting to happen — the team might skip planning, or forget to ask a client several crucial questions. We don’t rush the first stages of the product, letting clients and team members find their pace.
Increasing our team’s velocity becomes one of our priorities when we are at the point of execution. As soon as all features and design are laid out, we strive to minimize time expenses and complete all tasks as quickly as possible.
Individual metrics
Each of the used metrics should be available for the entire team and individual members alike. Developers, testers, designers should be able to see the pace and results of their work, not just a team as a whole. To make it happen, we use productivity tools and time trackers, like Jira and Hubstaff. All general reports are synchronized with individual ones — members can see what percentage of overall productive time their hours make.
Frequently asked questions
What is KPI in Agile?
Key Performance Indicators in Agile are measurable values that show the team’s efficiency in achieving business objectives. High-level KPIs focus on long-term results that depend on many factors — how many users were attracted by the final product, conversion rates, feedback quality. Low-level KPIs are short-term values that aren’t influenced by many connected factors — time spent on the project (usually calculated in hours), project’s budget (investment per task), etc.
Agile is a development methodology based on continuous improvement — software development analyzes data and adapts to it. The team analyzes Agile KPIs on its performance and work quality, and implements changes right away, in the next sprint.
What are Sprint metrics?
Sprint metrics are metrics that evaluate the deliverables of the software development team, checking how much value was delivered to the end customer by the end of each sprint . This value can be measured with a new feature, design improvements, or bug deletion.
The next goal of sprint metrics is to measure the effectiveness of the team in business terms — how quickly the solution was delivered to the market, what is the client’s feedback and the conversion levels. Lastly, metrics have to show developers’ satisfaction with their project and with the direction the team is taking in general.
Why are metrics important to Agile projects?
The whole point of the Agile methodology is that developers can always make corrections in the process after each sprint. Having tangible data, statistics, and graphs allows developers to understand what changes to make for the next sprint, and allows evaluating the end product’s quality — otherwise, it would be easy to get caught on in technical and organization details.
What is a sprint in Agile?
A sprint is a clearly defined period with the start and finish date when the team is set out to complete a certain number of tasks. Sprints are the basis of Scrum, Agile, and DevOps — teams divide their workload into smaller manageable chunks and track the results of each sprint. Each of these periods is treated like a mini-project with a beforehand planning, risk assessment, responsibility assignments, and post-sprint analysis.
Each project is composed of a series of sprints. Because each sprint is evaluated, it’s easy to spot issues early on and remove them on the next sprint — so the workflow is constantly optimized.
What are the metrics for software development?
Software development metrics are quantitative values that allow measure software development project’s quality, performance, and team’s health. They help to improve the development process as the project moves along and can be used for the team’s future work to improve organization and planning.
There are six main types of software development metrics:
- Formal code metrics — these are objective qualitative values that calculate how much work was performed by determining the number of the lines of code (LOC), Instruction Path Length, and others.
- Developer efficiency metrics — the team can calculate assignment code, active days, and time spent on the task.
- Agile process metrics — when the project is broken into sprints, the team can measure the efficiency of smaller parts of the project – lead time (how much time was spent for a certain development stage, which may contain several sprints), cycle time (one sprint usually falls under a single cycle), and velocity (how many tasks were done in a particular time frame).
- Operational metrics — these metrics check the software running characteristics and determines how effective the company staff is at maintaining the tool without third-party help. Mean Time Between Failures and Mean Time to Recover (MTTR) check how the software will run in natural circumstances and how equipped is the in-house team in handling the load.
- Test metrics — these metrics evaluate the code coverage — how much code was tested, the number of bugs, and the percentage of tech debt.
- Customer satisfaction — the team gets insights on end-users’ reactions to the product by measuring Net Promoter Score, Customer Satisfaction Score, and Customer Effort Score. These metrics evaluate, respectively, whether users would recommend the product and if they are satisfied with the result.
Agile metrics are a part of software networks, and they can comprise of other categories, as you can notice from our guide.
What are SDLC metrics?
SDLC is a software development lifecycle — a set of stages that a typical technology undergoes during its conception, execution, and finalization. An average SDLC consists of the following stages:
- Evaluating existing systems and defining their features, advantages, problems;
- Defining requirements for the new project functionality, design, target audience, etc.;
- Designing the system and outlining a typical user path;
- Developing the software, which means writing code, preparing hardware, and creating features;
- Testing software performance, functionality, security, interface, etc.;
- Deploying the software in its natural environment, where the technology will run long-term;
- Maintaining the system by updating the code, replacing or editing certain fragments, and removing bugs.
Each stage of SLDC can be measured by the following characteristics.
- Requirements: the team has to collect all the requirements for the project and evaluate the implementation of each of them in terms of time and money;
- Software quality: all Agile quality metrics can be used at the development stage of an SDLC;
- Test cases: the team has to calculate the number of performed test activities, its velocity, and final code coverage;
- Defects: to measure the efficiency of their work, developers, and testers need to be aware of the exact number of problems that arise during development;
- Tasks: measuring time spent and money earned per task allows evaluating if all team members are productive or not.
All metrics, described in our guide, can be used at different stages of the Software Development Lifecycle. The project is in the highest need for monitoring closer to the release because issues can pile up, and it’s easy to miss a critical defect in the product.
What is throughput in Agile metrics?
It’s the metric that calculates the number of stories completed per sprint. In Scrum, a similar metric is referred to as Sprint Velocity.
Conclusion
Agile metrics set up a solid base for making informed decisions throughout a software development project. Developers can use these insights to increase their efficiency in the next sprints and constantly improve the quality of their product. However, it’s worth noting that development metrics shouldn’t become an absolute priority in the software development project. Developers should rely, first and foremost, on project needs and audience preferences.
At Jelvix, we use a personalized approach to applying metrics to the project. First, we discuss the project’s MVP with the client, research the target audience, analyze competitive solutions, and only then chose the metrics that fit the project best. We don’t strive to apply every single KPI — instead, we select ones that reflect project needs the most.
Need help?
Ramp up your development resources to reach new business objectives.


