Have you ever wondered as to why data analysis is so important? Multiple companies across the globe generate a huge amount of raw and not used data. However, it can be brought to life if we extract meaningful and necessary information out of it.
This is what data analysis is geared at. The process of collecting and transforming data into meaningful insights may be challenging until you are familiar with good data analytical tools.
What are the Best Data Analysis Programs?
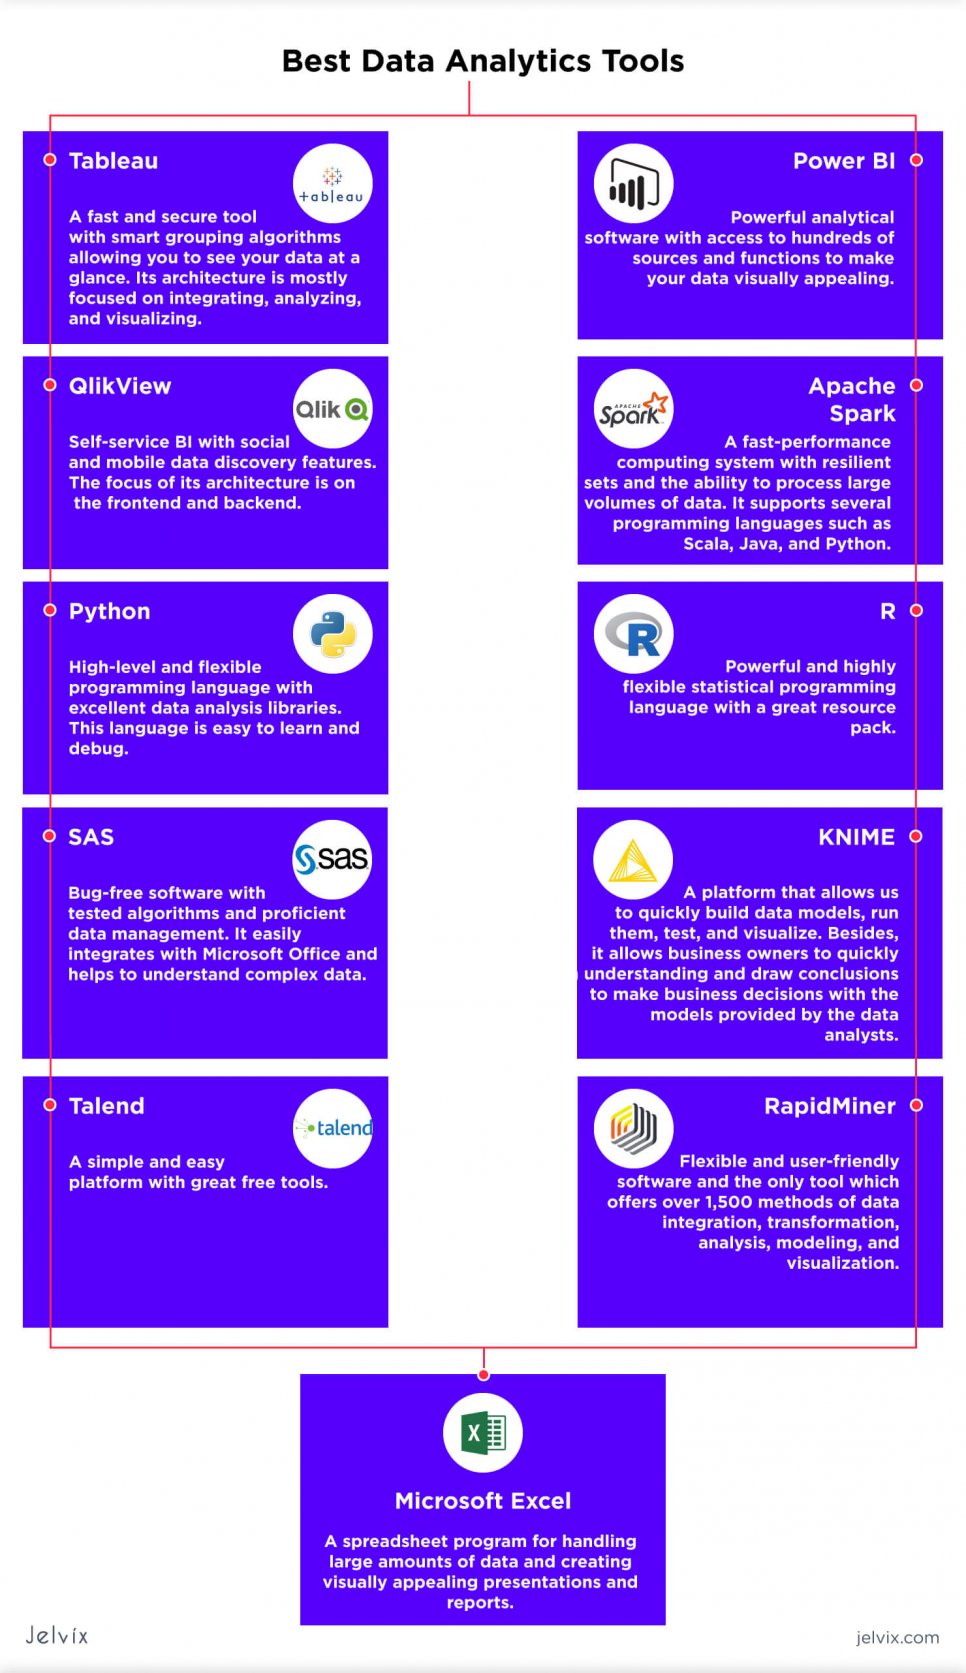
There are several data analytics types, and each one of them offers multiple tools for you to meet your goals. We’ve made a detailed data analytics software list researching the functionality, availability, and user-friendliness of the tools that are most frequently recommended.
The compilation of the top analytical tools is also based on frequent customer requests to find the best technical solutions to enhance their business. Check out the analytics tools that are the most effective and easy-to-use!
1. Tableau
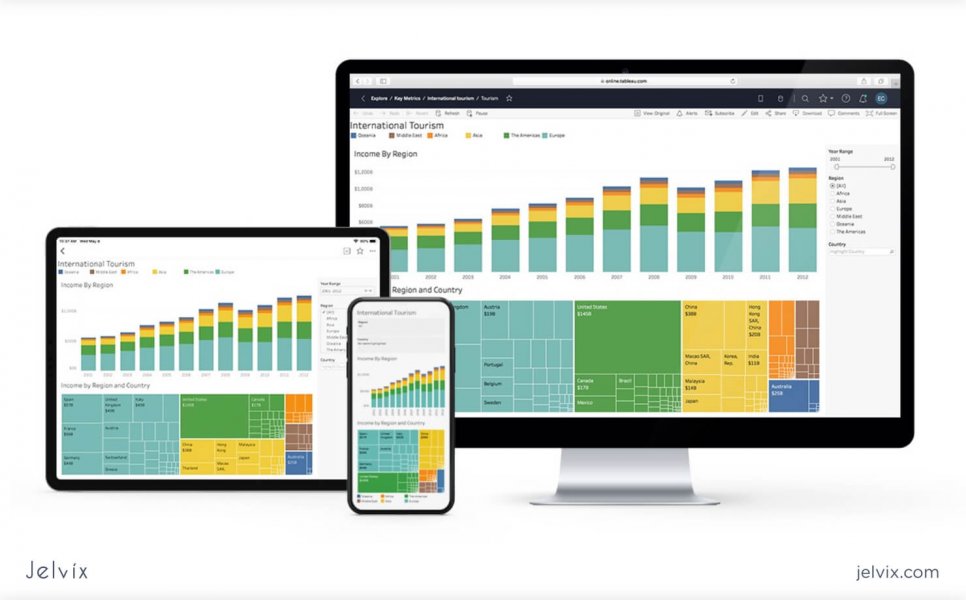
On top of the analytical pyramid, we have Tableau, a leader in business intelligence and data analysis, according to Gartner’s Magic Quadrant of 2020. It empowers everyone to see and understand data. Through this business intelligence for the entire organization, the users can explore and analyze their data in seconds. Let’s have a look at the beneficial and non-beneficial sides of Tableau.
Pros:
- The drag-and-drop option enables users to discover trends in a matter of seconds.
- Good prep builder visual and direct interface allows you to see all your data at a glance.
- Smart grouping algorithms simplify your data reorganization.
- Simple and secure data sharing with Tableau Online means that everyone in your organization can ask and answer their questions right from a browser, tablet, or phone.
Cons:
- Manual effort. After every data change, the user should update parameters manually.
- Price. Small and medium companies find license non-affordable.
- Implementation issues. The embedment is claimed to be smooth and easy, though, in practice, it may be challenging.
The companies using Tableau are Toyota, Marico, LinkedIn, and Amazon.
2. Microsoft Power BI
Here we have a second great analytic software for data visualization, insight sharing, and its implementation in apps and websites. This tool is developed to assist organizations in managing and analyzing data from a cluster of sources through a convenient interface. Being able to connect to a large number of sources, Power BI puts your data into practice with live dashboards and reports.
Pros:
- Hundreds of data sources that can be easily accessed on-premise or in the cloud to turn all the data into live interactive visuals. These sources are Excel, Salesforce, Google Analytics, social networks, IoT devices, etc.
- Regular updates enable users to collaborate freely, creating dashboards that deliver a 360-degree real-time view of their business.
Cons:
- Limited free version. The service offers numerous powerful tools for business analysis, though working with big volumes of data requires a paid extension.
- Bulky interface. The view of reports or dashboards is blocked by other icons.
- Lack of data preparation and cleaning tools.
Some of the companies using Power BI are Capgemini, Carlsberg, and Nestle.
3. QlikView
Another important tool for data analysis is QlikView, a self-service business intelligence platform where users can easily search, explore, and create dynamic apps to get business answers they need. With QlikView, you can analyze data and use your discoveries in the further decision-taking procedure.
Pros:
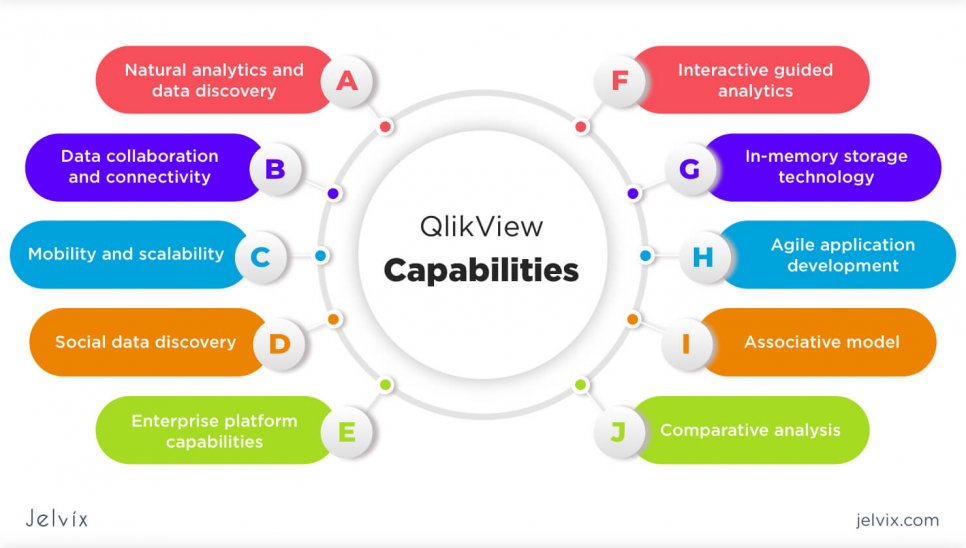
- Interactive guided analytics provided by the platform with in-memory storage technology. During the process of data discovery and interpretation of collected data, the platform suggests potential interpretations.
- Social and mobile data discovery features enable sharing individual data insights within groups or out of it. The users also may add annotations as an addition to someone else’s insight on a particular report and conduct discovery data interactively.
- Data visualization with color variations and multiple forms of generating analytical reports (charts, bar graphs, etc.)
Cons:
- Bad reporting (e-mail) functionality.
- Not suitable for non-tech staff. Non-tech users face considerable difficulties when trying to extract relevant information.
Capgemini, Cisco, Mercedes-Benz are some of the leading companies relying on QlikView.
4. Apache Spark
It is a fast general-purpose cluster computing system developed specifically for handling large-scale data processing and analytics. This is a powerful product to address different kinds of data processing needs. Furthermore, Spark provides primitives for in-memory cluster computing, making it very suitable for machine learning algorithms.
Pros:
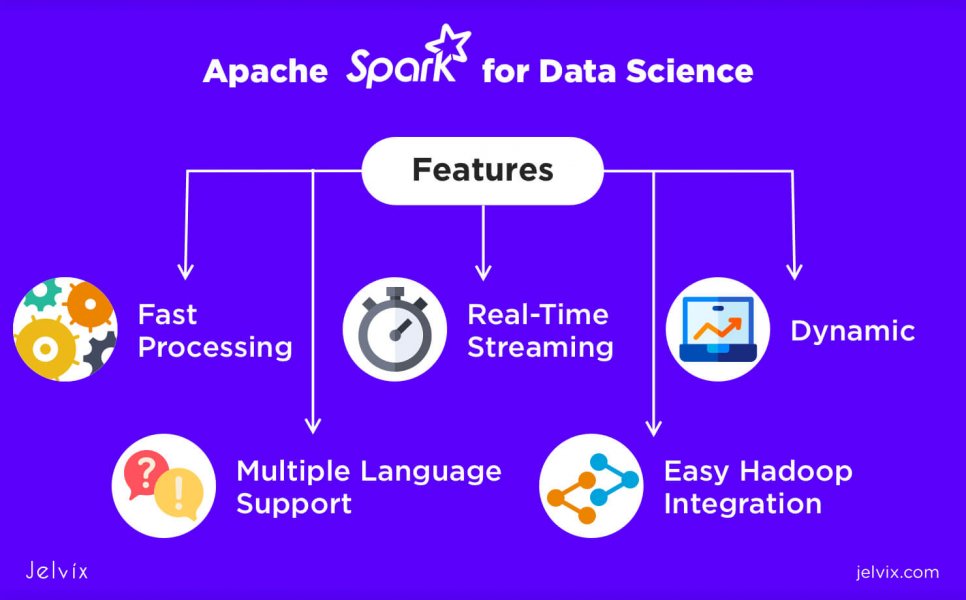
- Fast performance. The system works fast in terms of computation and utilization of various resources, such as memory, to perform a lot of iterative computations. In fact, it promises performance up to 100 times faster than Hadoop MapReduce for certain applications.
- Ability to process large volumes of data simplifies the challenging and compute-intensive task of processing high volumes of data.
- Availability. It is suitable for Linux, macOS, and Windows operating systems.
- User-friendliness. It has convenient programming interfaces for working with large datasets.
- Language diversity. The software supports several languages allowing developers to write applications in Scala, Java, and Python.
- Resilient data sets. Spark data sets are created to fix worker node errors removing the risk of data loss.
Cons:
- No file management system. In this case, other cloud-based platforms come to rescue.
- Small files issue. When used in integration with Hadoop, the problem with small files occurs because the framework provides a limited number of those.
- Manual configuration tuning. Performance tuning in Spark should be carried out manually.
Top companies that use Apache Spark: Netflix, Facebook, Uber, Pinterest.
5. Python
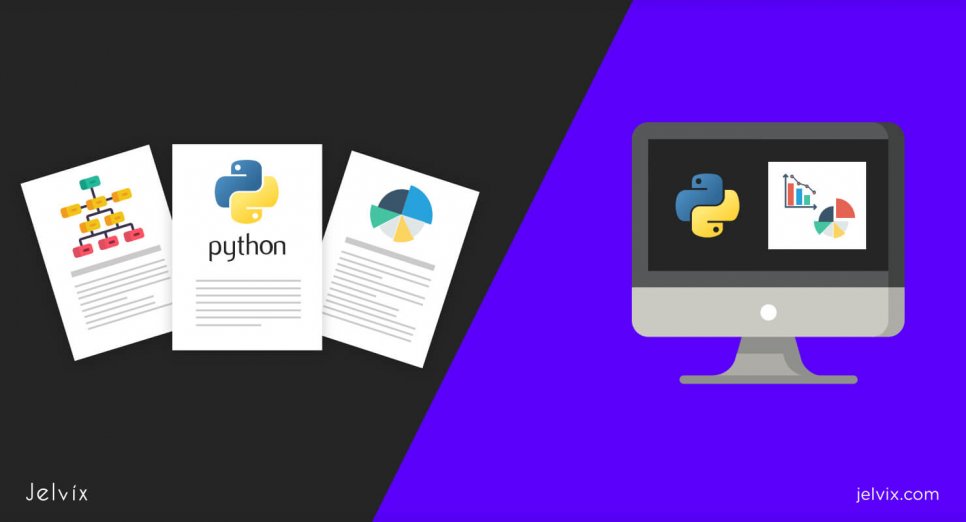
It is a high-level object-oriented programming language for general-purpose programming. It provides a Python data analysis library that is used for everything, starting from importing data from Excel spreadsheets to processing them for analysis. It is officially recognized language by Google and other large tech companies. Consider the pros and cons of Python before starting to work with it.
Pros:
- No difficulty in learning and understanding. The focus on productivity and code readability makes it one of the easy-to-master programming languages.
- Flexibility is demonstrated in cases when it comes to working on something new or building from scratch.
- Powerful analytics tool. The development of the statistical libraries turned it into an effective analytics tool.
Cons:
- Speed limitations.
- Memory-consumption. It is not the best option for memory-intensive tasks.
Here are some of the large companies using Python: Facebook, Alibaba, and Google.
6. R
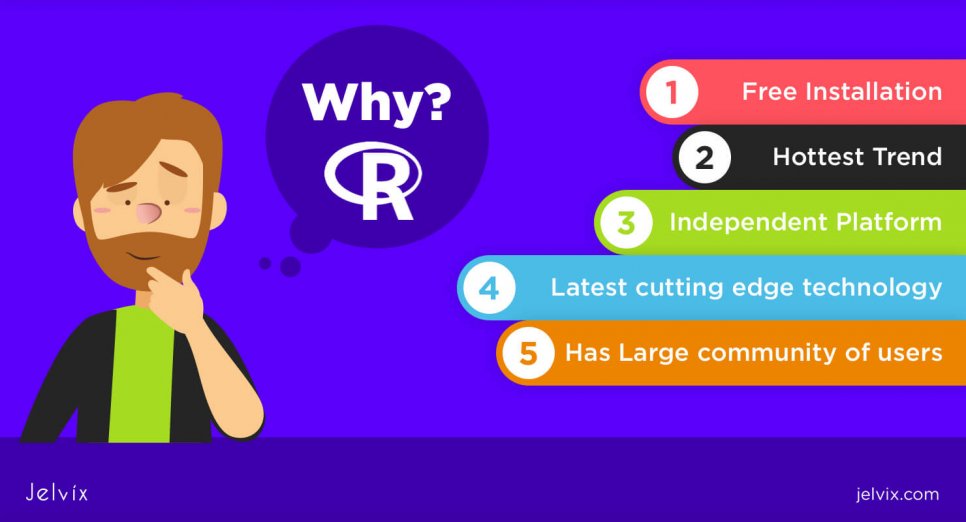
R is a software environment majorly used for statistical analysis and graphics. Apart from it, R is a second favorite language in the area of data science and data analysis. The reason it should not go without mention is that R is free and way better than some of the expensive commercially available alternatives. Here are more advantages to this programming language.
Pros:
- Data handling potential. The considerable amount of packages and readily usable tests makes it possible to utilize R with no need for package installation, which is required only for big data sets (here you can learn more about the best big data tools).
- Low entry barrier. It allows data analysts to quickly master R and start using it without wasting too much effort learning it.
- Incredible data visualization and graphics capabilities. Multiple packages contain various advanced graphical features.
- Great tool for statistical analysis.
Cons:
- Memory consumption. It is a memory dependent language and can consume a lot of space.
- Interactivity troubles. For analysis presentation prepared in R, the user needs to utilize more languages (e.g., Java).
In the list of companies utilizing R we can see Microsoft, Twitter, and IBM.
7. SAS
SAS is a prominent tool in the analytical market, which facilitates reporting and modeling analytics through effective visualizations and dashboards. It enables better data analysis using SAS SQL and automatic code generation. It also possesses good graphical capabilities, which are essential for data analysis procedures.
Pros:
- Easy integration with Microsoft. SAS allows smooth integration with Microsoft Office tools like Outlook and Excel by letting you create reports using it and by distributing them through it.
- Help with the understanding of complex data. SAS helps with a simple comprehension of complex data and allows you to create interactive dashboards and reports.
- Proficient data management. No comments needed.
- Ease of debugging. Apart from having simple syntax learning, the program gives a clear mistake explanation, which can be fixed effectively.
- Analyzed and tested algorithms. Every executed algorithm is primarily examined.
Cons:
- Closed source. It cannot be utilized generally as the software is not distributed in the public domain.
- Hard Text Mining.
- Slow speed of response for SAS codes.
Among the companies using SAS, we have Genpact, IBM, and IQVIA.
8. KNIME
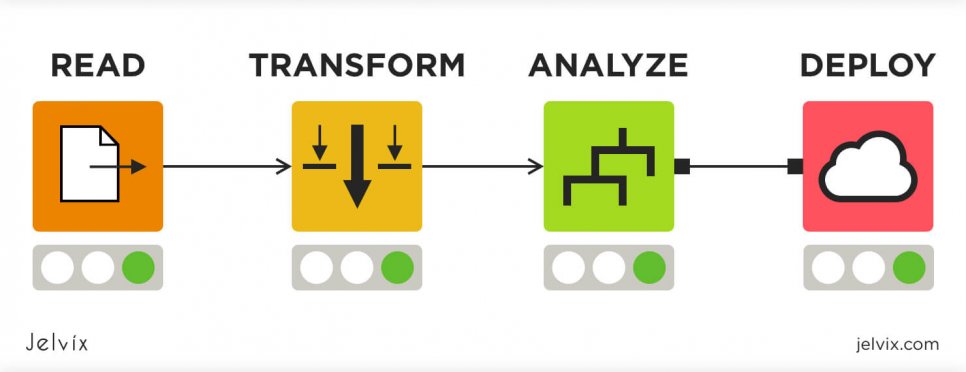
KNIME is the data analytics platform, which allows not only to analyze the data but also load, integrate, transform, and visualize it. It is a free data solution for Windows, macOS, and Linux, enabling its users to work with the data from the ETL steps to analytics, including statistics and machine learning visualizations.
Pros:
- Visual workflow facilitates tracking of processes which have or have not been done on various segments of data.
- Great free features. Fantastic. Explicit. We would say it’s one of the best free data analysis software platforms, which can be a credible alternative to expensive business intelligence platforms like Alteryx.
- Handling of large amounts of data.
- Fast problem-solving. Not much coding is required, as it can be done in a drag-and-drop manner.
- Multi-threaded in-memory data processing support.
Cons:
- Memory consumption.
- Slow speed. Occasionally, the speed may be below average (mostly during the opening).
Some of the companies rooting for KNIME are ASML, LEGO Group, and Siemens.
Check out the guide on how to find the perfect programming language for data science. We created the list of the most popular and frequently used tools to choose for your project.
9. Talend
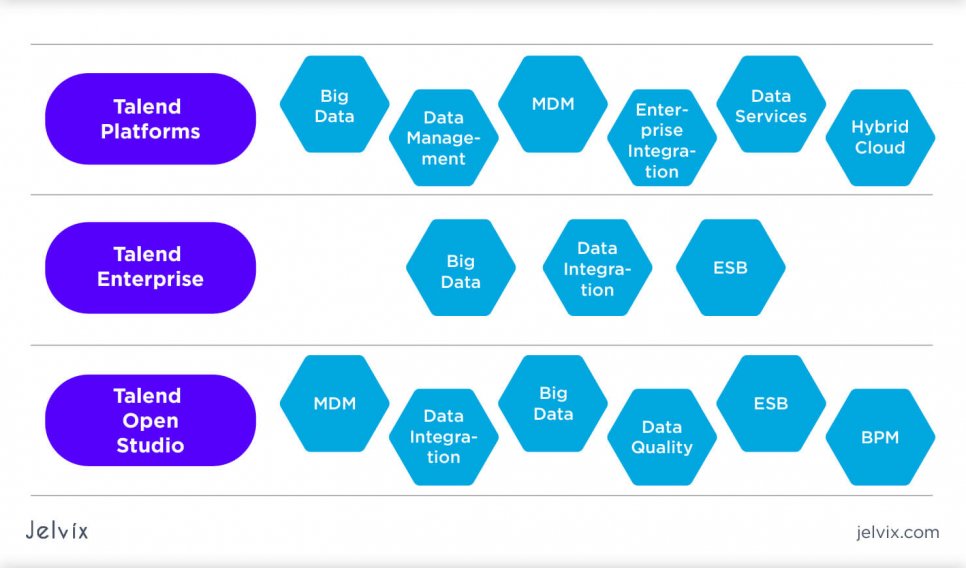
Talend is one of the leading platforms providing data for all your ETL needs. The platform empowers the organizations to turn data into business insights. Are you looking for the best software for data analysis? Here are the reasons to opt for Talend.
Pros:
- Quick deployment and development through automation.
- Great free tools. Talend offers numerous open-source tools that can be downloaded for free.
- Unified platform. It enables you to integrate with many databases, Saas, and other technologies. With the help of the integration platform, relational databases and cloud apps can be built ten times faster.
- Simple and easy use. The platform has a comprehensible and easy to navigate interface.
Cons:
- Unclear error explanation. Some errors may occur without a clear explanation of the reason and may be removed by restarting the program.
- Slow community support. It will take some time to get a response from the support team if any issues occur.
Among the famous companies who use Talend for data analytics purposes, we can name Domino’s Pizza, L’Oreal, and Capgemini.
10. RapidMiner
RapidMiner is a data analysis software platform, which provides an integrated environment for data preparation analysis and machine learning. This ETL is designed for predictive analysis, application, and data integration.
According to Open Insights Chairman & CEO Usama Fayyad, RapidMiner is a very consistent tool that “looks beyond what has happened and helps predict what might happen,” meaning it helps businesses to boost their efficiency.
Pros:
- The drag-and-drop ability allows users to drag and drop some columns as they are working on some analysis or exploring a dataset.
- Multiple exploration features (users may gain valuable insights from the data)
- Numerous methods for working on data. We find this feature particularly beneficial as the users get access to over 1,500 methods of data integration, transformation, analysis, modeling, and visualization – we haven’t found any other program on the market with such a profound range of data analysis tools.
- Excellent flexibility. The platform provides multiple flexible approaches to achieve unique goals and overcome challenges.
- Free plan and trial. You can explore and test all the features for free by starting a 5-day free trial.
- User-friendly design. The interface is convenient for both new and regular users.
Cons:
- Not a cheap option. In case you need to go beyond the free edition, the annual subscription may cost a pretty penny.
- Limited partitioning abilities for dataset to training and testing sets.
UnitedHealth Group, PayPal, and Mobilkom Austria are the companies that rely on RapidMiner.
11. Microsoft Excel
All of us have dealt with this program at least once at some point. This spreadsheet is an easy-to-use tool to create grids of numbers, texts, and various formulas. Unlike other data manipulation tools, Excel covers large data analysis and offers numerous tools to accomplish all your needs. However, despite a broad set of features, Excel happens to be underrated. Here are the reasons why we recommend and don’t recommend it.
Pros:
- Microsoft Office compatibility. It can be used with every piece of software in Microsoft Office to create more visually appealing presentations or reports;
- Task automation function. The program allows users to automate formatting and data organization.
- Excellent handling of large amounts of data. Whether you use a high-powered computer or an old laptop, Excel gives you an opportunity to analyze information and promptly filter and sort out what you are looking for.
- Good data organization. Excel enables its users to structure and arrange huge amounts of data into logical spreadsheets and charts.
- Multiple user access. This collaboration tool allows you to work on the spreadsheet together with other users wherever you are.
Cons:
- Hard to share. The troubles with sharing mostly imply installment of extra software on the computer.
- Not free. The annual subscription starts from $69.99.
- Limited by Microsoft and macOS X. The spreadsheet program is not available for other operating systems.
There are a lot of big companies that adopted Excel for analysis, with just several being named: EY, Amazon, and UrbanPro.
Summary
Data analysis tools are designed to transform and shape your data for analysis contributing to your business development. Here are the main arguments in support of each of the best business analytics tools. Decide what criteria matter the most and pick the most suitable option.
We hope that our overview helped you choose the best data analysis software. But if you are still unsure about using any of these tools, our experts will help you to sort everything out – just drop us a line.
Need a qualified team of developers?
Access the talent pool to scale your team capacity.


