We live in the times when carefully analyzed data determines the success of an organization and provides it with a competitive advantage. According to Gartner, by 2023, 90% of corporate strategies will cite information as a critical asset and analytics as an important business competence.
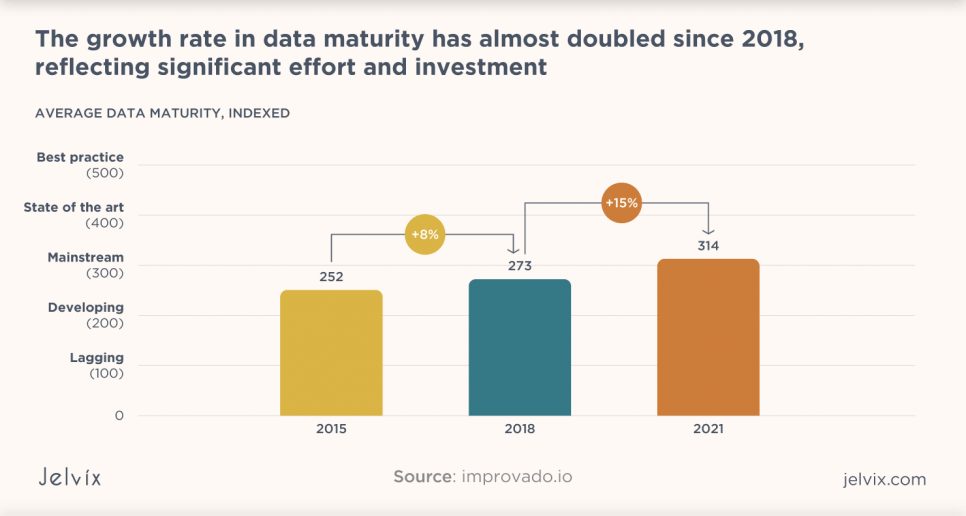
A recent study by the Boston Consulting Group found that the growth rate of data maturity had nearly doubled since 2018. However, companies often struggle to strategize, implement, and measure their analytic efforts. They find it difficult to determine whether they invest enough in analytics and if such investments pay off.
With these points in mind, the analytics maturity model is the easiest and most comprehensive way to track and define the evolution of analytics in your organization. After all, understanding how your company is doing now and where it will be in a year, five or ten, is critical to building an effective development strategy and speeding up its growth.
In this article, we discuss the concept of analytics maturity, scrutinize the levels of data analysis, and comprehend how to assess the level of maturity of your organization.
What is the Analytics Maturity Model?
The analytics maturity model explains different approaches, actions, and tools that must be present at each level of analytic maturity, considering the company’s technologies and culture. Сlearly defined criteria and metrics help clarify the current state of analytics in a company and outline ways to take analytics to the next level.
As you know, the lower the scale of a company’s complexity is, the less value its data has. But the higher it moves along the business intelligence path, the lower is the cost of processing data and keeping it up to date. High data maturity is when data is deeply embedded in the organization’s structure, and information is included in every decision.
Before assessing where data analysis is today, let’s look back in time. Previously, databases – SQL and NoSQL (also known as relational and non-relational) were responsible for finding, retrieving, processing, and analyzing data. Such databases contained only the most recent information, making historical research impossible.
With the advent of data warehouses and data lakes, systems that can collect and store information from many disparate sources within an organization and end-users have been able to pull information from multiple databases to uncover hidden insights. However, everything needed – from a colored chart or a spreadsheet created to enable business analysts or financial analysts to dig deeper into the data – had to go through a data scientist.
According to MicroStrategy Global Analytics research, many companies still have limited access to data. 60% of employees spend hours or even days getting the data they need. But in a world where you have to make thousands of decisions a day, accessing data doesn’t have to be that difficult.
Data teams are an investment in your organization, but they can only be profitable if they work with mature data. Business leaders have realized this and are now investing in creating or hiring data teams to democratize data in these organizations.
What are the Three Levels of Analytics Maturity in Organizations?
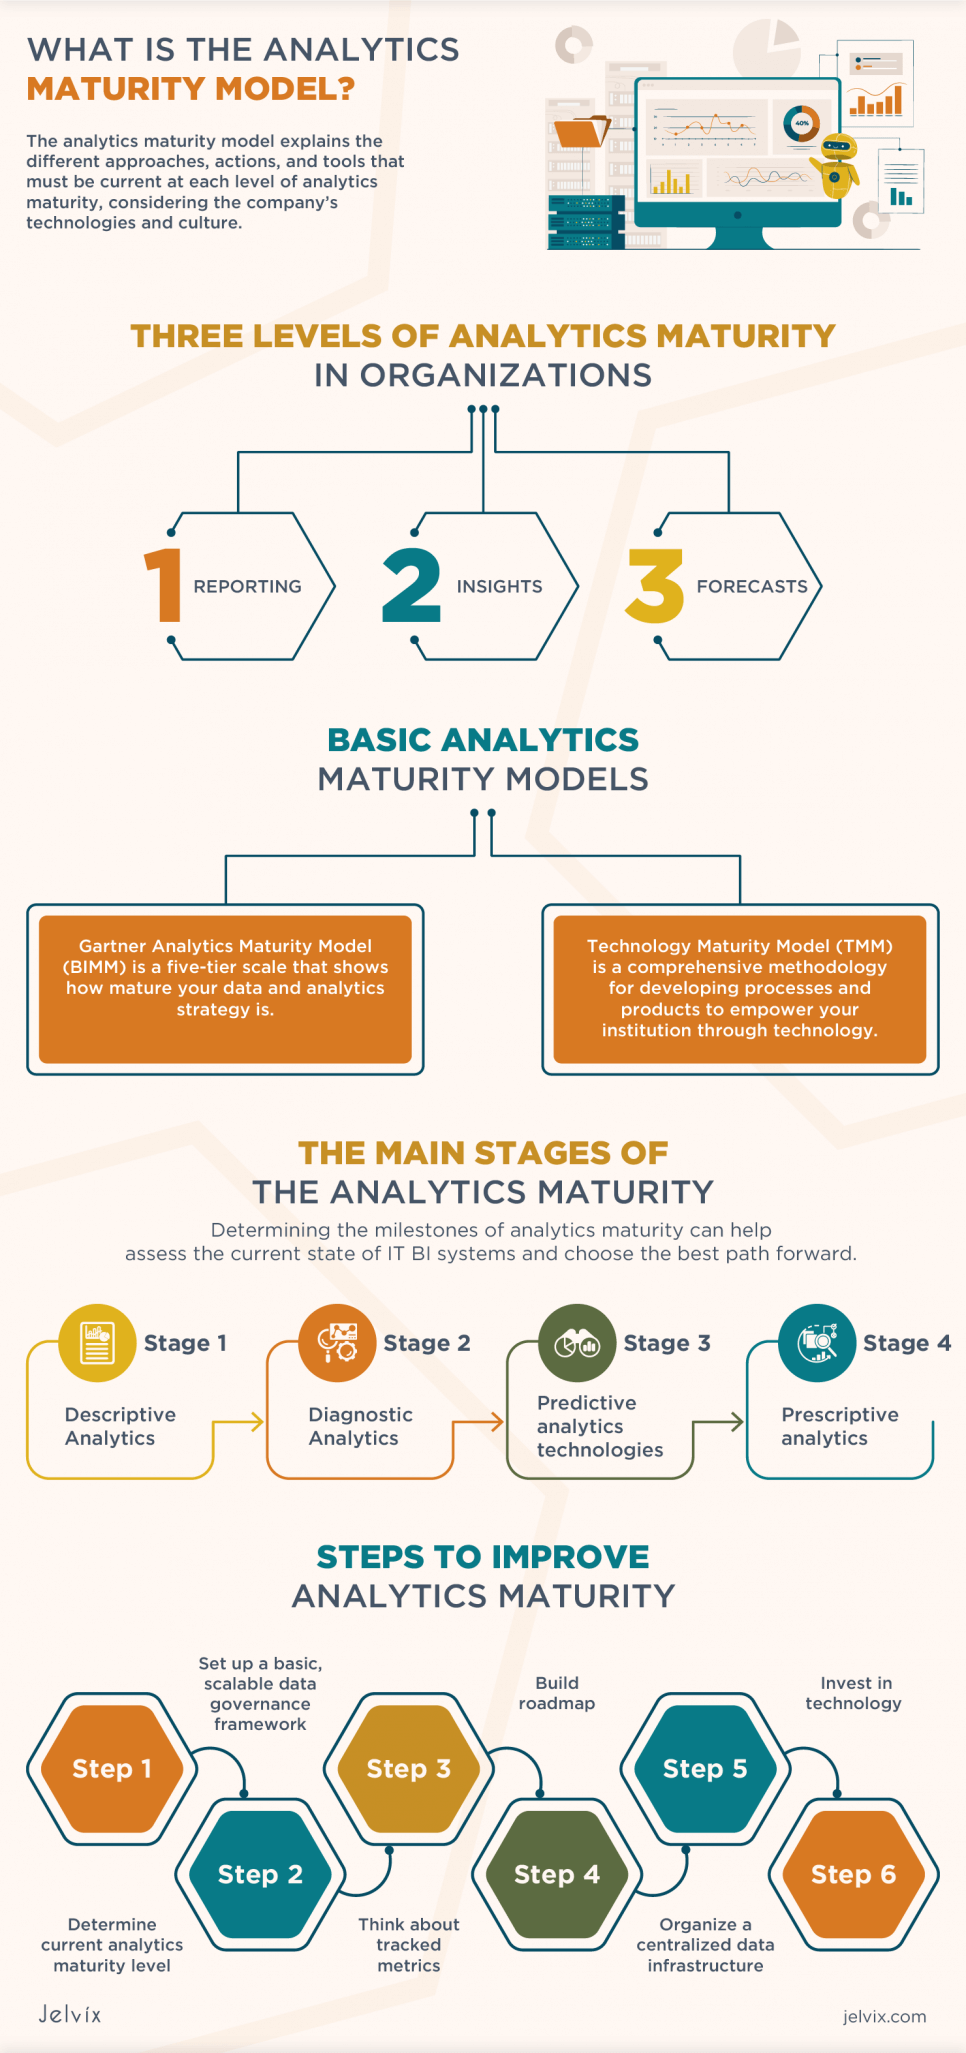
There are three levels of data analysis: reporting, analytics, and forecasting. As an organization matures in its data analysis, it climbs the ladder.
Reporting
Reporting is the easiest way to ask and answer questions. Answers provide an idea of what kind of data is needed but do not allow data to be standardized, organized, or tracked. The data does not always provide answers to questions that can help identify gaps and stimulate discussion of the data being collected. When getting information is difficult, you will never give up reporting.
Insights
While reporting, analysis is about gathering facts to communicate them, and ideas are about understanding the relationship between points. Information retrieval results from combining records systems, emphasizing finding connections in the data. Analysts can only jump to analysis if they don‘t spend all of their time creating reports, but correct reporting is necessary for understanding.
A data group that spends all of its time on numbers that already exist for gaining stakeholder support or adopting data processing tools will quickly find that it does not add new value to the business. Data manageability means you move to where decisions are influenced by data, rather than just looking for data that matches your queries.
Forecasts
Analyzing mature data uses forecasts to help move the business ahead. A product manager who can assess the financial implications of developing a new feature, both in terms of cost and potential profit, can make a much stronger case for prioritization than a colleague who relies on intuition and guesswork. The same is true for the entire organization.
An organization blessed with the ability to predict performance through advanced analysis is data-driven. They have reports to track these predictions; they have mechanisms to respond when the realities differ from these predictions. Therefore, they can adjust everything accordingly.
Basic Analytics Maturity Models
Data maturity models measure and describe how efficiently companies use their resources to extract value from data. They also guide the analytics transformation process. But they should not be confused with methodologies. Methodologies can be precious, but they prescribe and detail specific procedures and approaches. A good maturity model analytics might suggest some best practices but not a work plan for your project.
What is the Gartner Analytics Maturity Model?
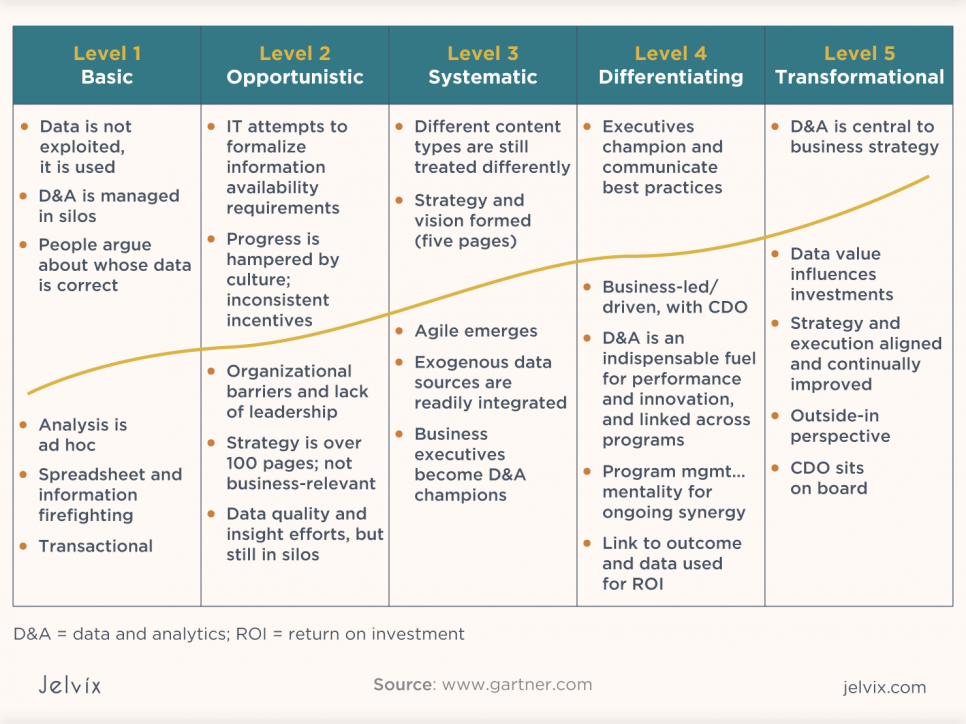
The Business Intelligence Maturity Model (BIMM) is a five-tier scale that shows how mature your data and analytics strategy are. There are business intelligence maturity models (we counted at least eight), but Gartner is one of the best models.
Gartner measures bi maturity based on a system’s ability to provide information and directly support proactive decision-making. The purpose of ranking analytical capabilities by maturity stage is to demonstrate the transformational potential of these systems.
The BIMM can give your business some initial balance, but your long-term strategy should not depend on the maturity model. Once launched, your data and analytics strategy should rely more on what your competitors are doing and how you match (and exceed) them.
In other words, the Business Intelligence Maturity Model points you to the same solid business common sense that you usually use. You need a business intelligence maturity model to understand how this general common sense applies to the specifics of data and analytics. Still, the model must be built on the mental capabilities you already have.
What is the Technology Maturity Model?
The Technology Maturity Model (TMM) is a comprehensive methodology for developing processes and products to empower your institution through technology. TMM development is a response to the ever-increasing resources allocated to use technologies. TMM defines specific steps and products that ensure the achievement of the goals and objectives defined in the technological plan. It consists of a cycle of improvement and maturity indicators.
- Vision: developing a vision for effective teaching and learning.
- Planning: establishing a process for planning the use of technology.
- Support: implementation of the necessary support systems, including staff development.
- Literacy: understanding the technology.
- Communication: supporting the necessary communication and collaboration.
What are the Main Stages of the Analytics Maturity?
Determining the milestones of analytics maturity can help assess the current state of your IT BI systems and choose the best path forward.
Lack of Analytics
Believe it or not, some businesses don‘t use technology and keep records with pen and paper. However, they collect and process data at this basic level, albeit without an analytical strategy or structure.
They collect the data in response to ad hoc requests from management as reports reflect financial results. But they base decisions on experience, market trends, tradition, politics, and even intuition.
The key problem of such organizations is the lack of vision and understanding of the value of analytics. They do not see the point in spending effort and resources on developing analytical skills and realize that many analytics modeling tools are completely free. Understanding this can be a great starting point towards.
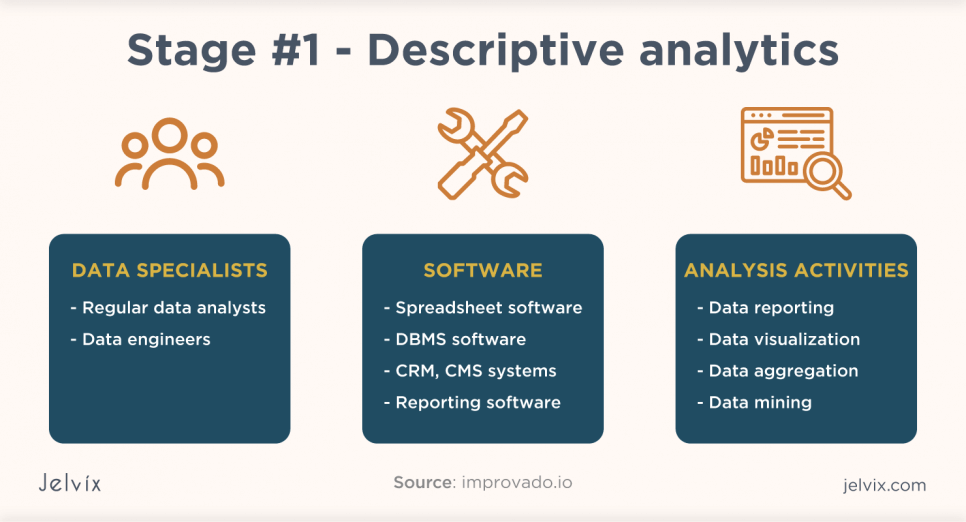
Descriptive Analytics
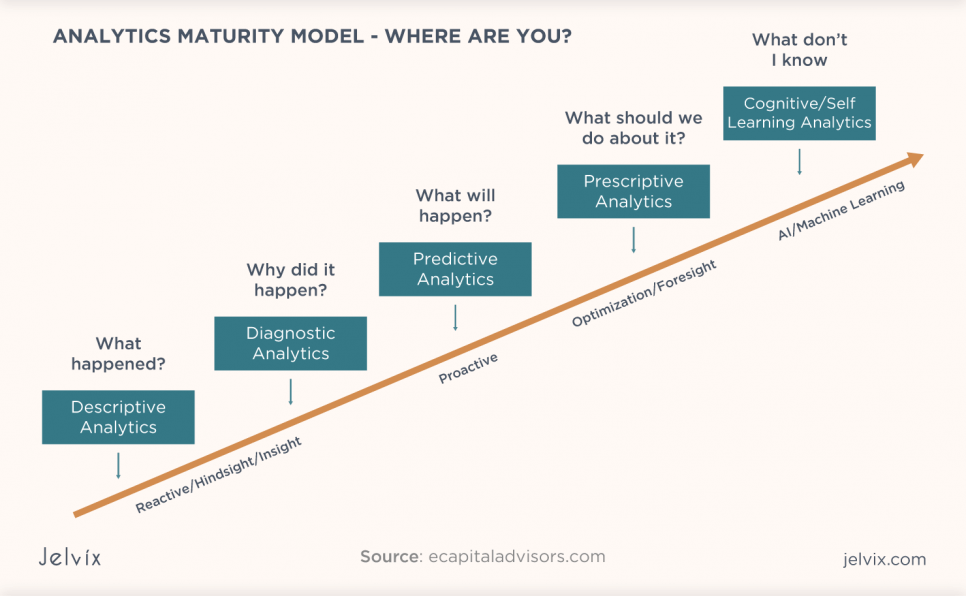
That is the next step in which organizations group data into useful information to produce a summary or a conclusion. Descriptive analytics are used to understand the past and present and ask questions such as “what happened?”. Processes and tools are becoming more flexible or non-standard. They focus projects on data visualization, reporting, and BI self-service.
The maximum profit of this level is a brief description of the current state of projects. Basic reporting functionality from IT analytics systems enables executives to track KPIs and other priority metrics.
Descriptive analytics provided by CRM and CMS systems, reporting, spreadsheet, and database management software. By the way, the IT business intelligence system at this stage may have relatively advanced reporting capabilities, despite the lack of more mature analytical capacity. But more complex reports and forecasts produced by the analytics system may no longer have a context.
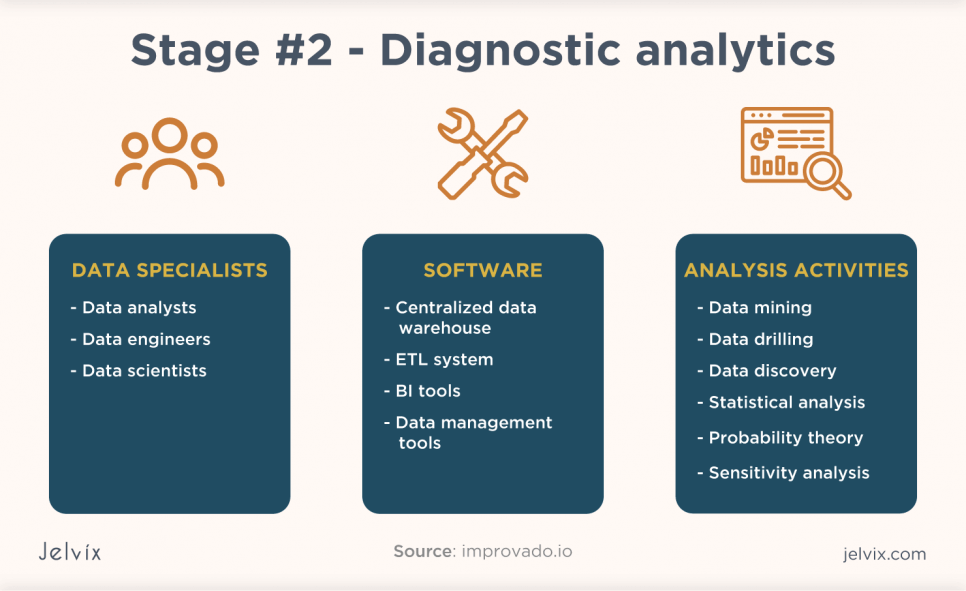
Diagnostic Analytics
Reporting from first-level systems can provide a descriptive context for an organization trying to track the health of its IT functions and projects. However, it can overlook important elements of the image. For example, metrics and key performance indicators (KPIs) can describe symptoms but not identify the condition or trend causing those symptoms.
Better IT business intelligence solutions enable you to dig deeper into your data to determine why and accurately describe trends or past results. This capability provides discoverability and a more meaningful presentation of the data. Analytical systems with diagnostic capabilities keep you from missing out on important hidden factors in your organization. IT teams that focus only on symptoms can eliminate the root cause of problems, creating inefficiencies and the risk of exacerbating the underlying issues.
Thus, finding the root cause of a problem is one of the greatest possibilities a second-tier system can provide.
Diagnostic analytics technologies
From a technological point of view, the data architecture is becoming more complicated and includes advanced tools with new functions.
- Business intelligence software. Instead of spreadsheets, analysts use BI software, such as Google Data Studio or Tableau. These solutions supply unlimited possibilities for creating informative dashboards for different operations (sales, marketing, business analysis, etc.)
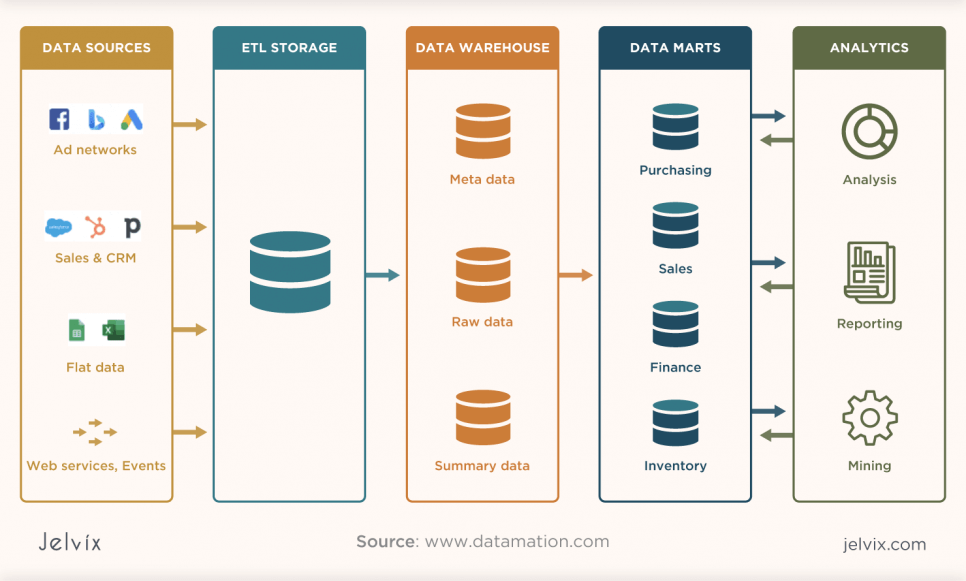
- ETL systems. The situation is even more progressive for data infrastructure. ETL systems come into play for data flow processing. ETL tools extract data from multiple sources, convert it into a single format, and store it in a centralized data warehouse. With the ever-growing volume of data collected, it becomes physically impossible to gather it manually. That is why analysts need a solution that can automate data aggregation while providing the highest granularity in the data. These actions significantly reduce the time spent on manual data manipulation and eliminate the possibility of human error when aggregating data. In addition, ETL systems can include various useful functions.
- Centralized data warehouse. That is another imperative on the road to analytics excellence. Analysts require a single source of truth for all the company‘s data. Storing data in spreadsheets is no longer an option with large amounts of data. The more information you collect, the longer it will take to update the table. Data warehouse facilitates access to analytical data and speeds up work with large datasets. It helps to map data between different departments.
How to switch to diagnostic analytics
- Improve the flow of data between departments. The first and most important step is to eliminate the silos of data between departments in the company. That will make data available to everyone, a proven way to improve analyst productivity. For example, marketing analysts rely heavily on sales data. Marketers spend more time accessing sales with an isolated data infrastructure by contacting sales directly. From senior management to ordinary employees, everyone will benefit from implementing a centralized data infrastructure.
- Upgrade your current technology stack. Continuous data flow is impossible without proper automation. Diagnostic analytics requires companies to build centralized data warehouses, implement ETL processes, and move to more advanced visualization tools.
- Hire talented specialists. To create a seamless data infrastructure and hire data engineers to set up and support everything in your path through the analytics maturity curve. In addition, analysts with a data science background will derive more useful insights by applying scientific models instead of simple algebraic methods.
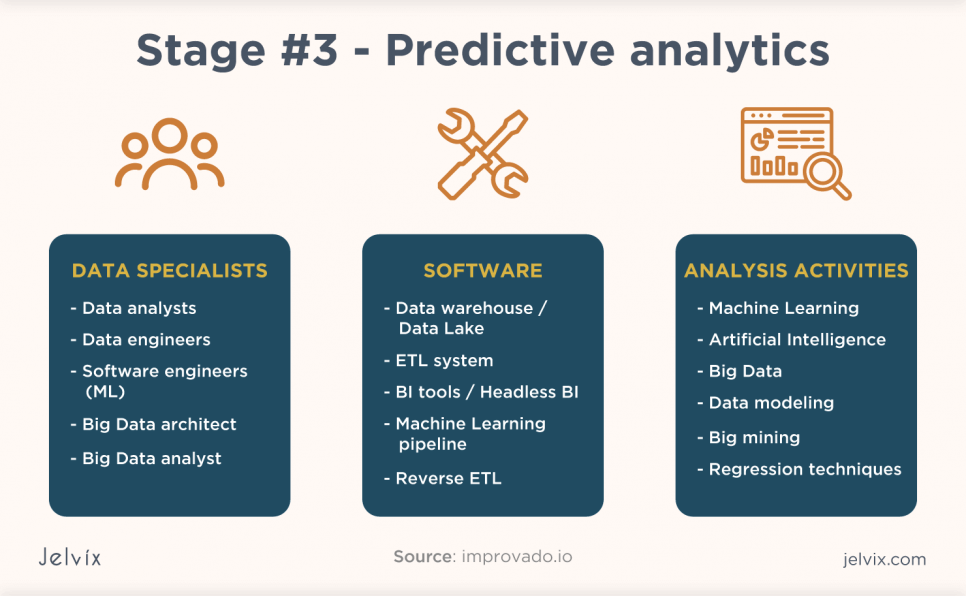
Predictive Analytics
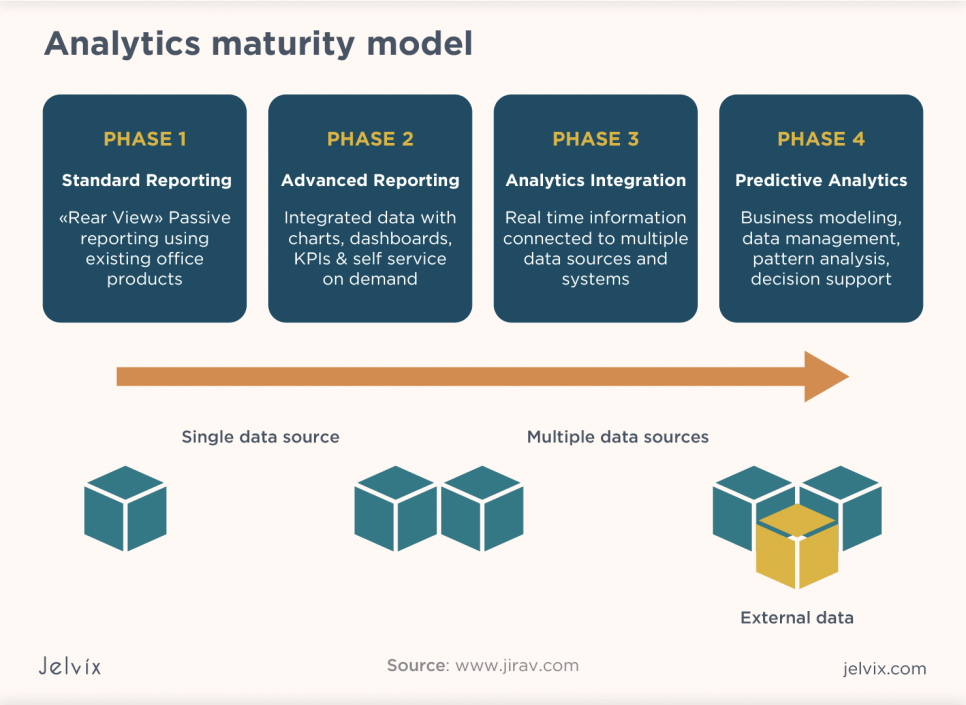
The first-level analytics systems can describe the problem in hindsight. Second-level systems can identify the root cause of a problem through understanding. Tier 3 systems provide foresight to prevent issues before they arise through their predictive capabilities.
With predictive analytics, you can already ask questions such as “what if we change X?” that is the highest stage in which data is examined to identify and predict future trends. At this stage, projects focus on predictive modeling, statistics, data mining, and advanced analysis.
Organizations at this level of data and analytic maturity have gone beyond simply providing tightly controlled data access and introduced user-driven access to data at a more atomic level. By extending their ETL data pipelines with data virtualization, organizations at this tier can be more flexible in responding to business data needs by providing more convenient access to data.
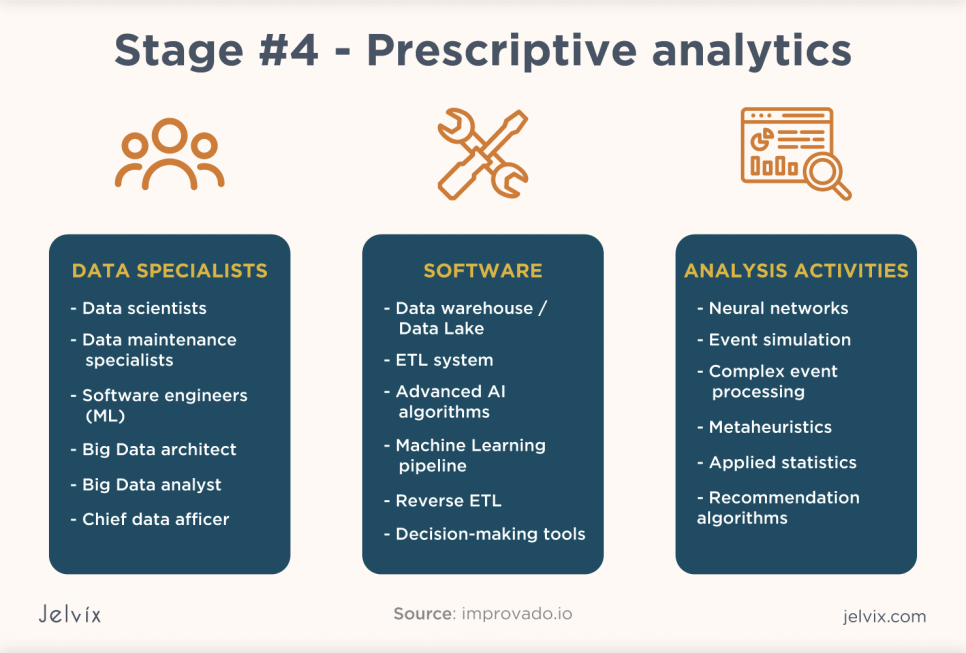
Like the forecasting phase, prescriptive analytics rely entirely on big data. However, it uses even more sophisticated statistical approaches and models, such as:
- Heuristics;
- Event simulation;
- Complex event processing;
- Neural networks;
- Recommendation algorithms and engines.
More progressive organizations at this level can augment their data with third-party data to provide richer datasets for deeper insights. Besides providing business users with self-service access, organizations can proactively maintain access to AutoML tools so that citizen data scientists can create predictive models to improve business forecasts and customer service. Specific features and capabilities that a tier 3 business intelligence solution can include:
- Ready-made domain-specific models of ML and AI.
- Forecasting indicators / KPIs.
- Retrieving historical data.
Predictive analytics technologies
By integrating automated pipelines into your data ecosystem, information flows through all possible channels and is stored in your data warehouse.
To extract useful information from a continuous data stream, you need big data technologies such as distributed computing and parallel processing to simultaneously analyze massive datasets on dozens of computers.
In addition, a generic ML algorithm will not cope with such a volume of data. Instead, you need an ML pipeline that automates the learning workflow, creates new models, trains them, and handles other ML management activities. Tools like Microsoft Azure, Google Cloud Platform, or SageMaker can serve as the basis for the ML pipeline.
How to switch to predictive analytics
- Give priority to machine learning. Analysts rely on ML algorithms to decide, and predict future events and outcomes. That is why software engineers and data scientists must train new machine learning models, integrate machine learning techniques into existing data infrastructure, and look for machine learning applications in analytic activities.
- Maintain a data-driven culture. Predictive analytics requires the effort of everyone in a company, not just data scientists and analysts. Each professional can use the collected information because of the data infrastructure. You should invest in training your employees to query data, use business intelligence tools, and analyze the results of your actions yourself. With this approach, data scientists will focus on more crucial tasks than creating hundreds of different departments‘ queries. Non-techies will also benefit because they can experiment with data and see detailed work results without relying on anyone.
- Integrate advanced analytics software. Ensure your employees have access to predictive analytics software that‘s right for their industry. For example, marketing and finance staff will need highly specialized tools tailored to their business operations. This flexibility in the choice of tools provides more opportunities for analytics and speeds up the workflow.
Prescriptive analytics
The term predictive analytics once illustrated the horizon of ML. Still, organizations quickly realized that forecasting does not always provide the information they need to respond to a future.
That is the highest and most transformative stage in which an organization can use data to prescribe the best course of action, predict possible future results, and uncover future opportunities. Here are some technologies that make accurate predictions possible:
- Artificial Intelligence;
- Machine learning;
- Big data.
These tools generate recommendations for the optimal way forward with minimal risk and maximum net positive results. With prescriptive analytics, you can answer questions such as “how can we learn from this and solve this problem automatically?”
On a day-to-day basis, prescriptive capabilities can help improve the efficiency of IT workflows while reducing costs. But achieving true prescriptive capabilities requires better AI models, tuned through ML and tailored to your specific data sources, environment, and market niche.
Ryan Gross explored the various use cases of AI for both predictive and prescriptive analytics. His research says predictive analytics is the most profitable company globally ($1.2 trillion). Therefore, companies need to move towards this stage of analytics maturity to stay on trend.
How to switch to prescriptive analytics
- Automate decision-making processes. Since prescriptive analytics can help find the right solution to a problem, they must clearly understand the subject of the analysis. That is why businesses should invest in automated decision-making processes and use analytics as the basis for further innovation and corporate culture.
- Pay attention to data quality assurance. Even the most modern systems sometimes crash. Therefore, when these systems advise and decide, the results of their work should always be checked. If inconsistent data enters the pipeline, it can lead to incorrect results and disrupt the overall analytics workflow. In this way, quality assurance is becoming an integral part of a healthy data ecosystem.
Steps to Improve Your Analytics Maturity
Analytics plays a crucial role in decision-making and overall company development. However, there is no need to view certain capabilities within a strict hierarchy, especially since some capabilities may technically represent several stages of maturity at once. We are not saying this to deny the value of the Gartner Analytics Maturity Model, but to emphasize that there is no need to prioritize any step that does not match your organization‘s specific needs and objectives.
Instead, IT leaders need to accept that a mature approach to organizing and collecting data is more important than advanced analytics. They need vision, strategy, management, a human skill set, and technology to support their analytic infrastructure. These efforts create the basis for achieving their abilities and desired effect. So, what are the 4 pillars of data maturity assessment?
- Strategy: direction, roadmap, and destination;
- Culture: risk tolerance, appetite for data-driven decision making;
- Organization: commitment to continuous improvement, data privacy, collaboration, and trust;
- Capabilities: the expertise, processes, and tools you need to meet your data and AI goals.
Here are some actionable steps you can take to increase your company‘s analytics maturity and use your data more effectively.
Determine your current analytics maturity level
87% of respondents to a recent Gartner survey said they have low analytic maturity. How would you rate your organization‘s analytical profile? Are you a laggard, an innovator, or somewhere between? Do you have resources that can turn your data into useful ideas? Or is it more of a data management issue, aligned business goals, or overall organizational support?
Tip: Answering these questions will give you a substantial foundation before integrating new tools and new analytical approaches.
Set up a basic, scalable data governance framework
Whenever you need to add a source, your engineers or data analysts will have to deal with its API or create your own. That takes time and distracts employees from their immediate tasks. You can often reduce the time to integrate your data only by knowing which data sources you intend to use.
Tip: Find out what data is used and where it comes from. Create and track KPIs for the use of website analytics tools and more. Also, don‘t forget to measure the results of any decisions and changes you make.
Think about metrics you are tracking
But don‘t focus on metrics that only tell you how much. Instead, prioritize those that give you practical information about why and how. It can help you comprehend the reasons for customer behavior, make predictions about business processes, and act accordingly.
Tip: Give employees access to data, educate them on using it, and encourage new ideas. Try to eliminate silos between departments.
Build your roadmap
Nearly every company of any size grapples with one or more challenges when building an analytics team and becoming a data-driven organization. And the strategic roadmap is a sort of a plan and a schedule with priorities for addressing maturity issues.
McKinsey found that “building a strategy for data and analytics“ was the top reason chosen by 21% of respondents for why companies were performing well in analytics, as well as a top concern selected by 24% for organizations that were underperforming.
Tip: The main idea is to move forward according to your priorities. As you gradually add more management, control, and functionality, you move up the maturity scale. As a result, you will create a data-driven culture that leads to better business outcomes.
Organize a centralized data infrastructure within your company
Analytics don‘t work with silos and department-isolated data. Providing all employees with equal access to data and data processing tools should be your top priority. Then, in the future, they can use them to analyze their efforts and predict the results of their initiatives without any help from data scientists.
Tip: The ability to unleash your data’s potential, improve efficiency through orderly and consistent data will enable you to move to practical and future-oriented applications such as AI and ML.
Invest in technology
As already mentioned, each stage of analytics maturity implies the integration of new tools and approaches to analysis. Business intelligence tools, ML pipelines help you interpret data and get value from it.
Tip: Make sure new technologies and capabilities can be built into your processes and combined with existing knowledge.
Properly analyzed data can provide an unrivaled competitive advantage by helping you understand your customers better, respond to market changes faster and more accurately, and unlock new growth opportunities.
Conclusion
We hope that the data and analytics maturity model framework will help you rank your organization on the analytics maturity scale. You can use it as a roadmap to improve your organization’s master data and analytics capabilities.
Even if you are just embarking on this journey, you are doing your company an invaluable service. The ideas and new information you discover along the way, whether descriptive or cognitive, can drive your company’s continued growth. And with the right analytics solutions that analyze this data, you’ll gain actionable insights that can give you a competitive edge.
It’s also essential to understand that the journey through the maturity levels isn’t always straightforward. Sometimes you might even go backwards, for example, when you have to re-platform or when you first move to the cloud.
So, if you want to increase the maturity of your analytics but do not know how, you can turn to external experts like Jelvix. Contact us to find out what it takes to get your organization from where it is today to where you want it to be in the future.
Need a certain developer?
Leverage the top skills and resources to scale your team capacity.


