Did you know that the United States’ economy loses up to $3 trillion annually due to low data quality?
Poor data analysis leads to making wrong decisions and choosing the wrong business strategy. Wrong business decisions drop productivity and leave customers unsatisfied, which results in reputation damage and financial losses for the companies.
To avoid data processing mistakes, the companies apply a data pipeline for moving and storing the data. It’s the major operation in any data-driven enterprise since it is impossible to analyze the data until it is structured and moved to the data warehouse.
In this article, we will consider the following topics:
- Data pipeline definition, basics of data pipeline architecture, and tracking the process of transforming the raw data into structured datasets;
- Most common use cases of data pipeline system such as Machine Learning, Data Warehousing, Search Indexing, and Data Migration;
- Capabilities of AWS data pipeline;
- Learn how to build a data pipeline.
What is Meant by a Data Pipeline?
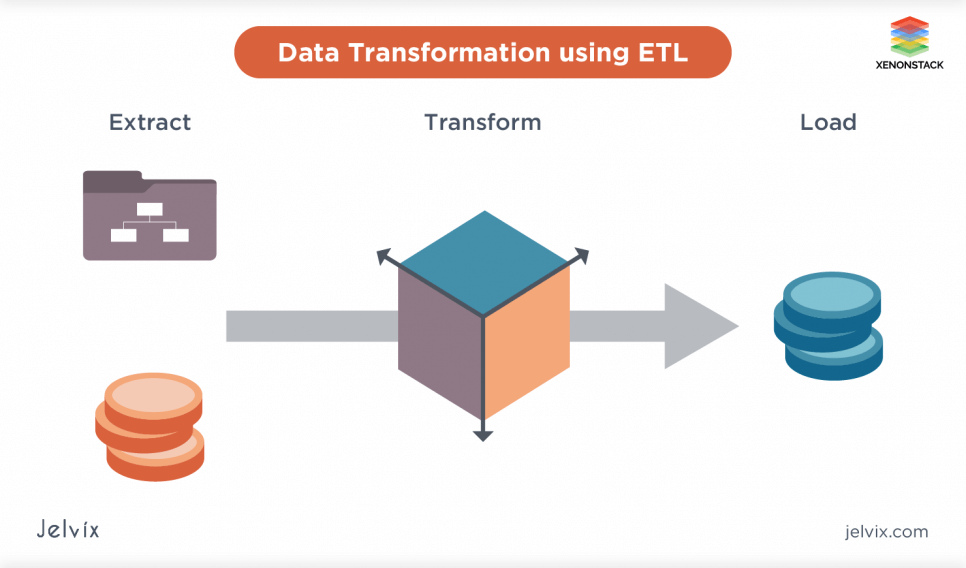
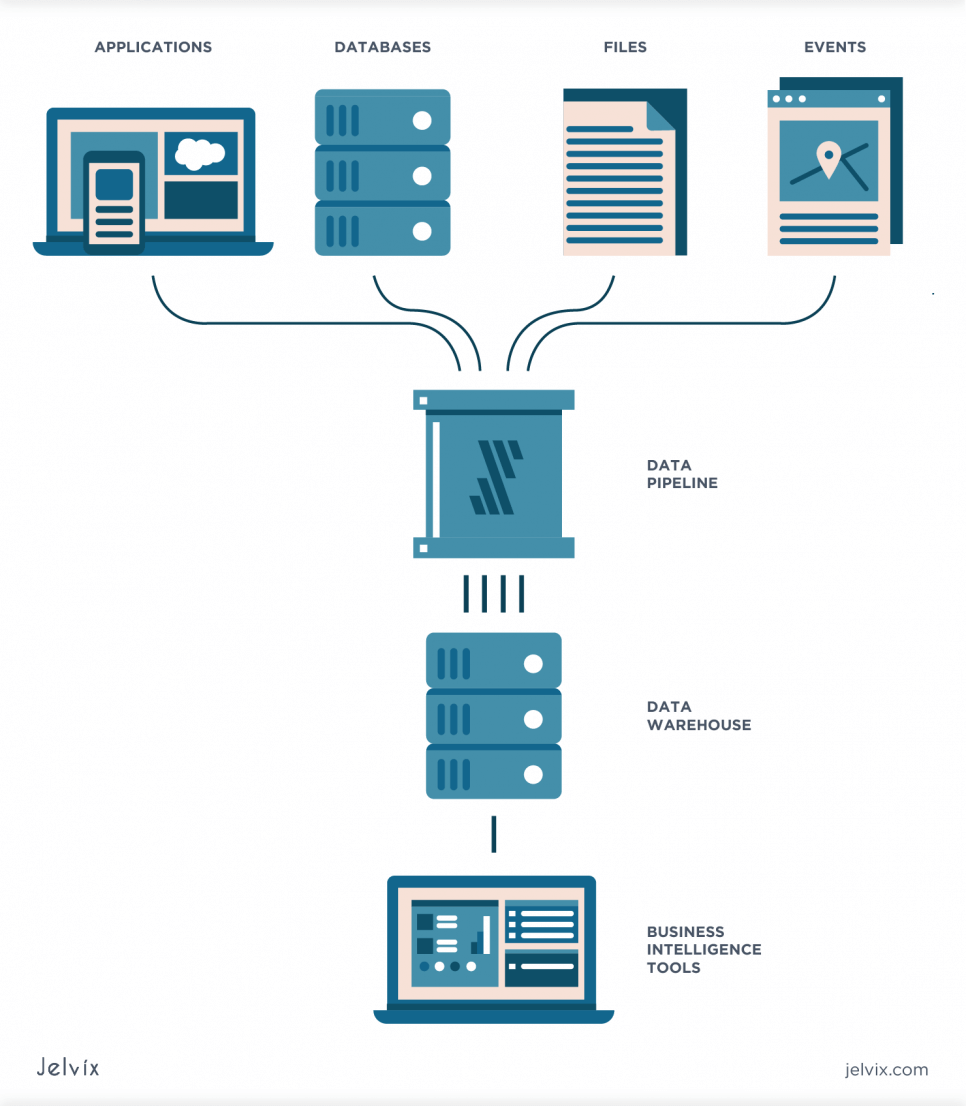
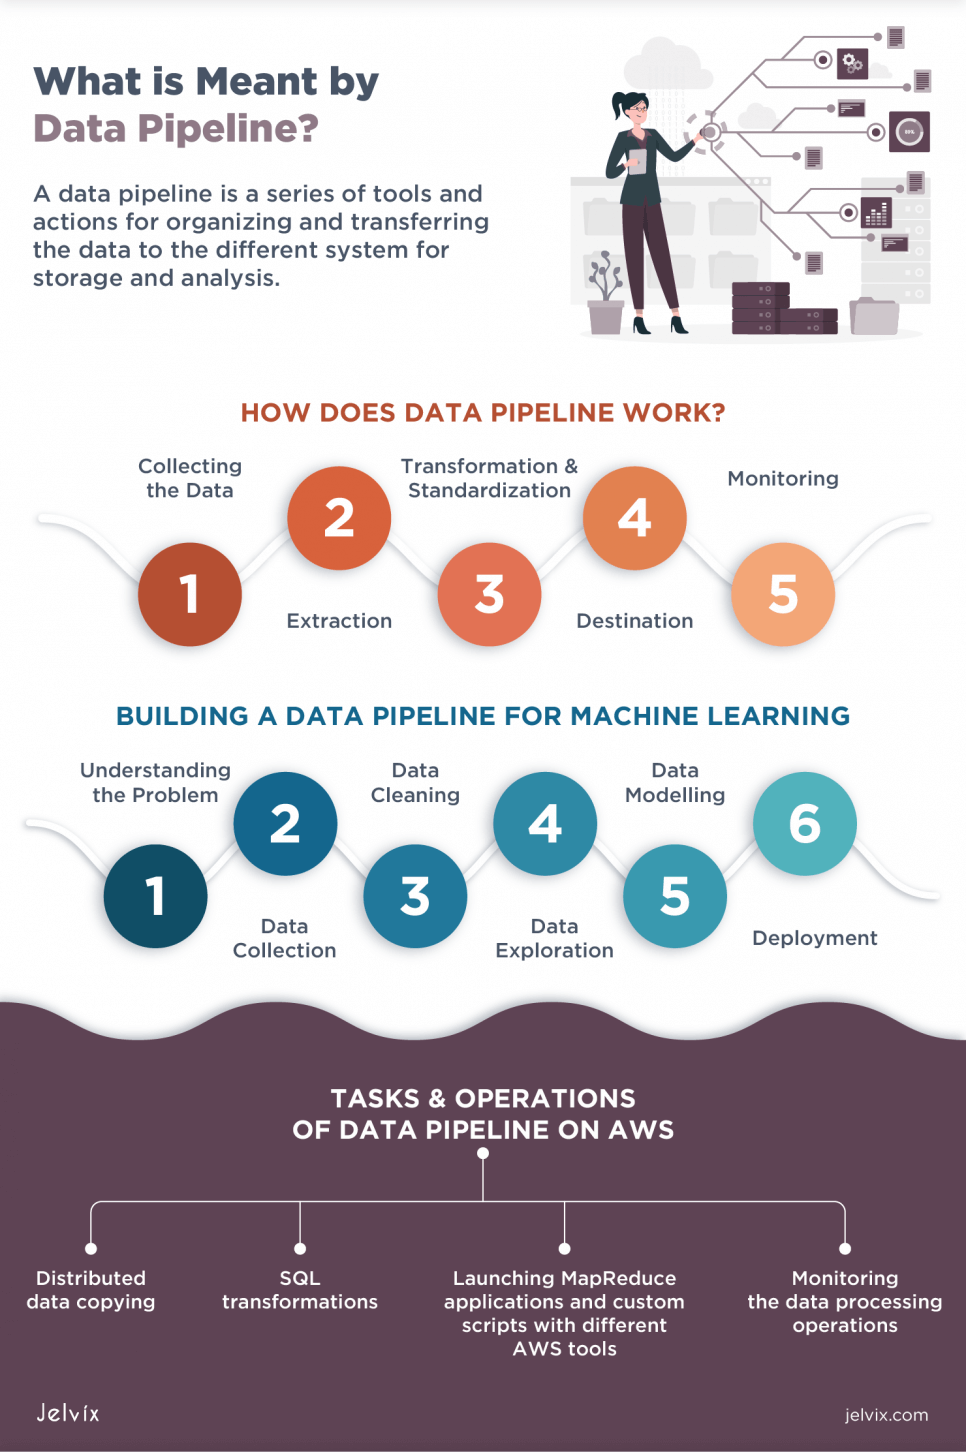
A data pipeline is a series of tools and actions for organizing and transferring the data to different storage and analysis system. It automates the ETL process (extraction, transformation, load) and includes data collecting, filtering, processing, modification, and movement to the destination storage.
The pipeline serves as an engine sending the data through filters, applications, and APIs. It also automatically gets the information from numerous sources and transforms it into a structured high-performing data set.
As a data pipeline example, you can collect information about your customers’ devices, location, and session duration and track their purchases and interaction with your brand’s customer service. This information will then be arranged, creating a profile for each customer and storing it in a warehouse.
How Does a Data Pipeline Work?
The raw, unstructured data is located at the beginning of the pipeline. Then it passes a series of steps; each of them transforms the data. The output comes as an input for the next stage, and this process continues to the end of the pipeline.
Step 1. Collecting the Data
This is the start of a data pipeline. The system gathers the data from thousands of sources, such as databases, APIs, cloud sources, social media. After retrieving the data, the business must follow security protocols and practices for correct performance and safe-keeping.
At this stage, the data sources are the pipeline’s key components since, without them, there will be no input for analysis and moving through the pipeline.
Step 2. Extraction
After the raw data is collected, the system starts reading each piece of data using the data source’s API. Before you start writing the API-calling code, you have to know the characteristics of data you want to extract and check if it fits your business purpose. After the data is extracted, it goes through one of the data processing strategies: batching or streaming.
The businesses choose the model depending on the required timeliness of access to processed data.
Batch & stream processing
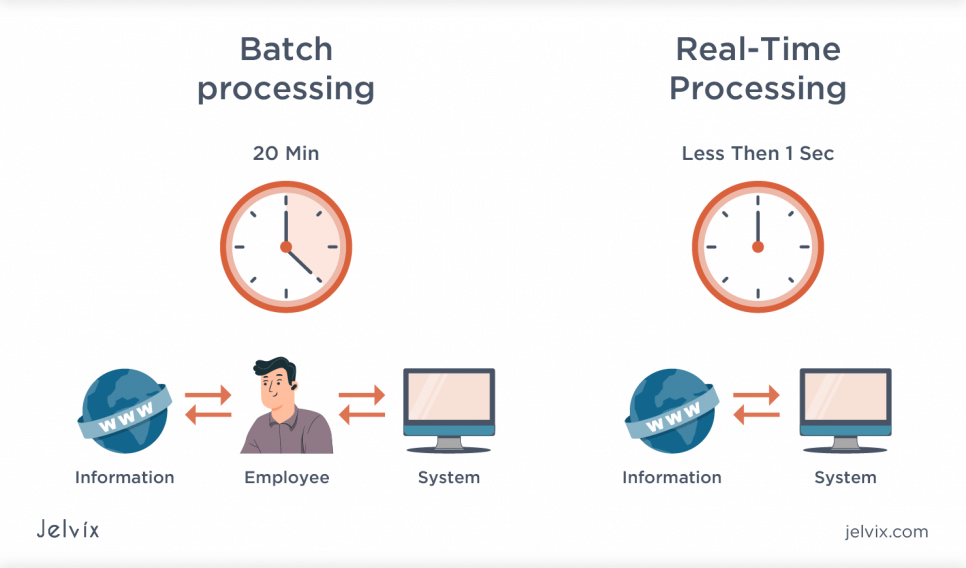
If the sets of records are extracted and counted as one group, batch processing is applied. It is sequential, and the extraction mechanisms process groups of records according to the criteria established by developers. When the data is grouped, the batch doesn’t collect new records for processing them in real-time but sends the existing ones to the destination point.
On the contrary, streaming passes individual records as soon as they are created or recognized by the system. While batching is applied for processing lots of different types of data, streaming is used in situations where you need real-time accepting and monitoring the records.
By default, the companies use batch processing since it is easier and cheaper, and apply streaming only when continuously refreshed data is critically important.
Step 3. Transformation & Standardization
After batching\streaming, you need to adjust the structure or format of data. It includes filtering and aggregation of data making it more readable for further analysis.
Types of data transformation
Regardless of the place of transformation, it’s an important stage of processing since it prepares the data for further analysis. Here are the most common types of transformation:
- Basic transformations — only the appearance and format of data is affected, without severe content changes.
- Cleaning — the process of detecting, correcting, and removing corrupt records from the dataset. It identifies inaccurate parts and replaces \ deletes them (NULL ⇒ 0, male ⇒ F, female ⇒ F);
- Deduplication — identifying and removing duplicates;
- Format revision — character, unit of measurement, date\time conversion to the common standard;
- Key restructuring — establishing relationships between the tables.
- Advanced transformations — the content and the relationship between data sets are changed.
- Derivation — applying the business rules to the data for getting new values from the existing information (calculating taxes based on the revenue);
- Filtering — selecting certain rows, columns, or cells;
- Joining — linking the data from numerous sources;
- Splitting — splitting a single column into multiple ones;
- Data validation — if any data is in the row is missing, then it’s not processed to avoid misrepresentation;
- Summary — summarizing the values for getting the total figures (for example, by calculating all purchases of a particular customer, it is possible to count a lifetime value metric);
- Aggregation — collecting the data from numerous sources and arranging it in the system.
Step 4. Destination
This is the final point where the clean data is transferred. Further, it can go to data warehouses for visualization and analysis. Less structured data is stored in data lakes for data scientists to work with significant amounts of information.
What is the difference between data warehouses and data lakes?
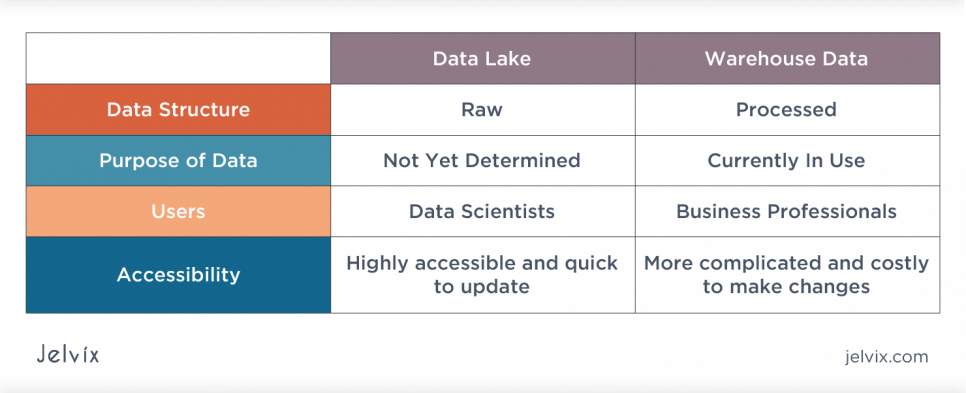
Data lakes mainly contain raw, not yet processed data and warehouses — structured and refined datasets. Here are some more differences between them:
- Data lakes require much more storage than data warehouses.
- The raw data from a data lake can be quickly analyzed for any purpose. The datasets in warehouses are currently in use in a specific project.
- The data lakes are used by data scientists and machine learning engineers for further processing. The business professionals operate the data from warehouses and use it for implementing business strategies.
- The data warehouses contain precious information and require serious security measures. The data lakes are easy-to-access and update.
Step 5. Monitoring
A data pipeline is a complex system run by lots of software, hardware, and networking components. An error can occur at any stage, and all the analytical processes can be failed.
To ensure the system works properly, the engineers continuously check the pipeline data by monitoring, logging, and alerting the code. This helps keep the system safe and sound and ensures that the data is accurate.
What are Data Pipelines Used for?
Different software solutions require exchanging the data between different datasets and require the use of the pipeline. Here are the major areas of data pipeline use.
Machine Learning
The efficiency of machine learning operation heavily depends on the quality of the input. Poor quality of the historical data will ruin the process of creating a predictive model and making future decisions.
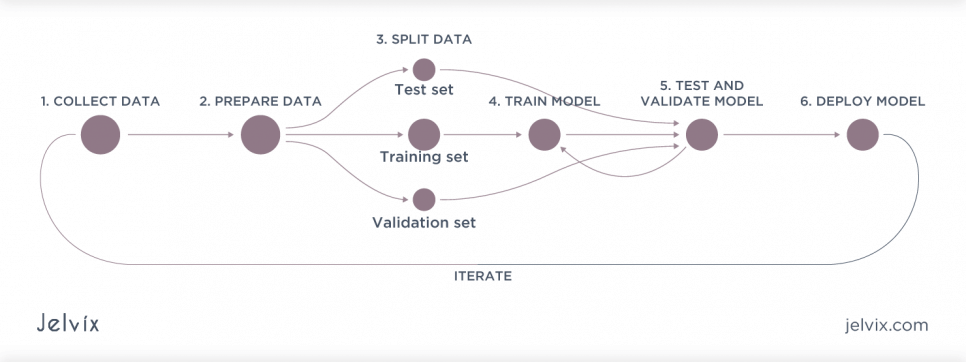
The pipelines are used to automate the training workflow and to prepare the data for training. This is not so essential at the early stages, but the importance of a pipeline grows along with increasing data volumes. Due to this, ML engineers avoid using the raw data but need to prepare it first.
Data preparation includes:
- Exploring the data — checking the hypothesis for your model and the characteristics of the data needed for training.
- Cleaning up the data types and formats, adjusting the training dataset — as we already mentioned, the quality of input data directly affects training results. For example, if you need to create an anomaly detection model, the dataset should consist of images of both normal and anomalous parts.
- Labeling datasets — for supervised learning, you need the datasets labeled with informative tags indicating the correct answers.
- Splitting the data into training, validation, and testing datasets — you will need enough data at each stage of training and testing the ML model.
Tools for building ML pipelines
The machine learning pipelines are created individually for each model, but here you can find a list of tools that will simplify the development process:
- Google ML Kit — deploy the models in the mobile application via API.
- Amazon SageMaker — an MLaaS platform for conducting the full cycle of preparing, training, and deploying a model.
- TensorFlow — an open-source machine learning framework developed by Google with robust integration with Keras API.
Also, we’ve prepared a list of tools for general operations with data pipelines:
- ETL, data preparation and data integration tools — Informatica Power Center, Apache Spark, Talend Open Studio
- Data warehouse tools — Amazon Redshift, Snowflake, Oracle
- Data lakes — Microsoft Azure, IBM, AWS
- Batch schedulers — Airflow, Luigi, Oozie, or Azkaban
- Stream processing tools — Apache Spark, Flink, Storm, Kafka
What is the Data Pipeline in AWS?
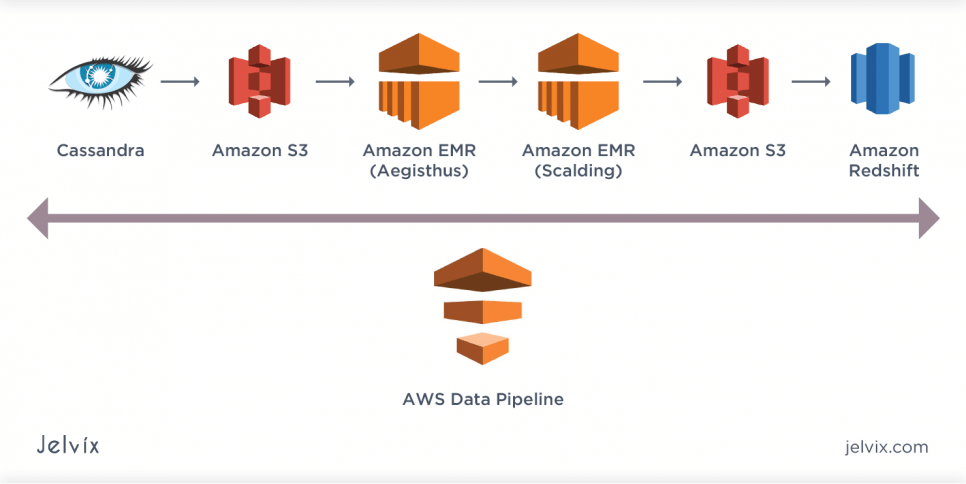
AWS data pipeline is a web-service allowing data processing and moving it between different computing services, AWS storage, and local data sources. It helps to easily create complex data processing pipeline operations and guarantee their fault-tolerance and high availability.
You will have unlimited access to storage and data processing & management capabilities. It will also be possible to migrate the output to different AWS services like Amazon S3, A Amazon RDS, Amazon DynamoDB и Amazon EMR, etc. To find out more about its capabilities, you are welcome to read an AWS data pipeline tutorial.
Other advantages of the Amazon data pipeline:
- 24/7 availability of resources
- Automated management of individual and interdependent tasks
- System of failure alerts and restart of the failed operation
- Integration with local and cloud data storage system; easy access to data from locally isolated storage
Tasks & operations of data pipeline on AWS
It will allow creating a command pipe for performing the routine data processing operations. You can configure the chain of dependencies consisting of data sources, objects, and custom operations. The pipeline will be able to perform the following operations on a regular basis:
- Distributed data copying;
- SQL transformations;
- Launching MapReduce applications and custom scripts with different AWS tools;
- Monitoring data processing operations.
You only need to set the data sources, schedule, and the necessary operations. For example, the AWS data pipeline supports the built-in actions for performing standard operations, such as data copying between Amazon S3 and Amazon RDS storage or performing the queries according to the Amazon S3 journal records.
There are two types of computation resources where AWS Data Pipeline operations can be run: Amazon cloud services (EMR or EC2 instances) and on-premise installations under your management.
In the first case, you will use Amazon services to create and deploy the data pipeline that will also be located at AWS hardware. This is a relatively cheap solution ideal for small companies that don’t have the opportunity to build and maintain their own data center.
If you choose on-premise installation, you will be responsible for creating the full infrastructure to collect, process, and store the data. This is the most secure option, but only giant companies have enough resources to maintain this system.
Let's discuss Enterprise Data Warehouses' purpose, examine the difference of database vs data warehouse, and explain how to set up and manage one.
Building a Data Pipeline for Machine Learning
Data science is used for comparing and interpreting the data collected with the help of the data pipeline. Here we will give a simple AWS data pipeline tutorial that is ready for use in data science and ML.
Step 1. Understanding the Problem
The model that will be built after the end of the pipeline will entirely depend on the problem you intend to solve. You will need to adjust the algorithms for different requirements, so before building a pipeline, you need to define and understand the targeted business challenge.
Example:
Imagine building an engine for a shopping platform that will recommend the products to the visitor. You aim to have a first-time visitor spend as much time on the platform as possible and make the first purchase. So, before creating a model, you need to identify a new visitor’s behavior patterns. For sure, this algorithm will have no use in case of dealing with returning clients.
Technologies:
- Querying relational and non-relational databases: MySQL, PostgresSQL, MongoDB
- Distributed Storage: Hadoop, Apache Spark
Step 2. Data Collection
Once you have a clear understanding of the problem, you come to the most tedious process — data collection. The more data you collect, the higher will the efficiency of the final model be. We should also bear in mind that the reliability of the model depends not only on the number but also on the input data quality.
Example:
Speaking about our shopping platform, you will have to collect the datasets referring to first-time visitors of similar resources. You will track their way of exploring the products and the links they click. If you mix this dataset with the dataset of returning customers as you will add rubbish that will interfere with the final model’s work.
Technologies:
- Scripting language: Python or R
- Data Wrangling Tools: Python Pandas, R
Step 3. Data Cleaning
We have already discussed the process of data examination, formatting, and structuring. The system removes broken and missing records and invalid data at this phase and generates robust, structured data pools that you will feed to analytical tools.
Technologies:
- Scripting languages (Python, R)
Step 4. Data Exploration
Here you will discover lots of useful information: hidden patterns of visitors’ behavior, trends, and correlations. They will become the basis of your future model. Data visualization tools are your best friends at this stage: they will present the insights as clear tables, charts, diagrams.
Example:
Having analyzed the behavior of first-time visitors of shopping platforms, you may discover some seasonal trends:
- In summer, people are more likely to look for swimsuits and sunglasses;
- In autumn — warm hats, cozy scarves, and funny cups for hot beverages;
- In winter — Christmas decorations and candles;
- In spring — flower pots and gardening supplies.
Extraordinary events also influence consumer behavior: due to the Covid-19 pandemic, people have to buy face masks and disinfectants.
Technologies
- Data visualization tools: Matplotlib, Seaborn, Numpy, Pandas, Scipy in Python and GGplot2 in R
Step 5. Data Modeling
Once you know the behavior patterns, it is time to develop and test different Machine Learning methods and algorithms. The one with the best results is selected, then it is refined, tested, and trained until perfection. Remember that the quality of the model depends on the quality of the input data!
Technologies:
- Building ML models: Scikit-learn library (Python), CARET library ®
- Building Deep Learning models: Keras, TensorFlow
Step 6. Deployment
Congrats, you have finished your model! Now let’s make it available for the users. There should be a possibility to scale and continuously update the model with new data available.
Conclusion
The data pipeline system is an excellent solution for any data-driven business. A properly organized and managed pipeline will provide precious information for making operational and strategic decisions.
After reading this article, we hope that you have built a clear understanding of data pipeline architecture and the way it works. Here at Jelvix, we will help you design and implement the pipeline for your business’s specific needs. If you would like to get a free consultation and let us offer you a pipeline solution, you are welcome to contact the team.
Need a qualified team?
Unlock new business opportunities with the first-rate dedicated development team.


